European vs Immigrants from France Average Family Size
COMPARE
European
Immigrants from France
Average Family Size
Average Family Size Comparison
Europeans
Immigrants from France
3.14
AVERAGE FAMILY SIZE
0.2/ 100
METRIC RATING
292nd/ 347
METRIC RANK
3.15
AVERAGE FAMILY SIZE
0.4/ 100
METRIC RATING
284th/ 347
METRIC RANK
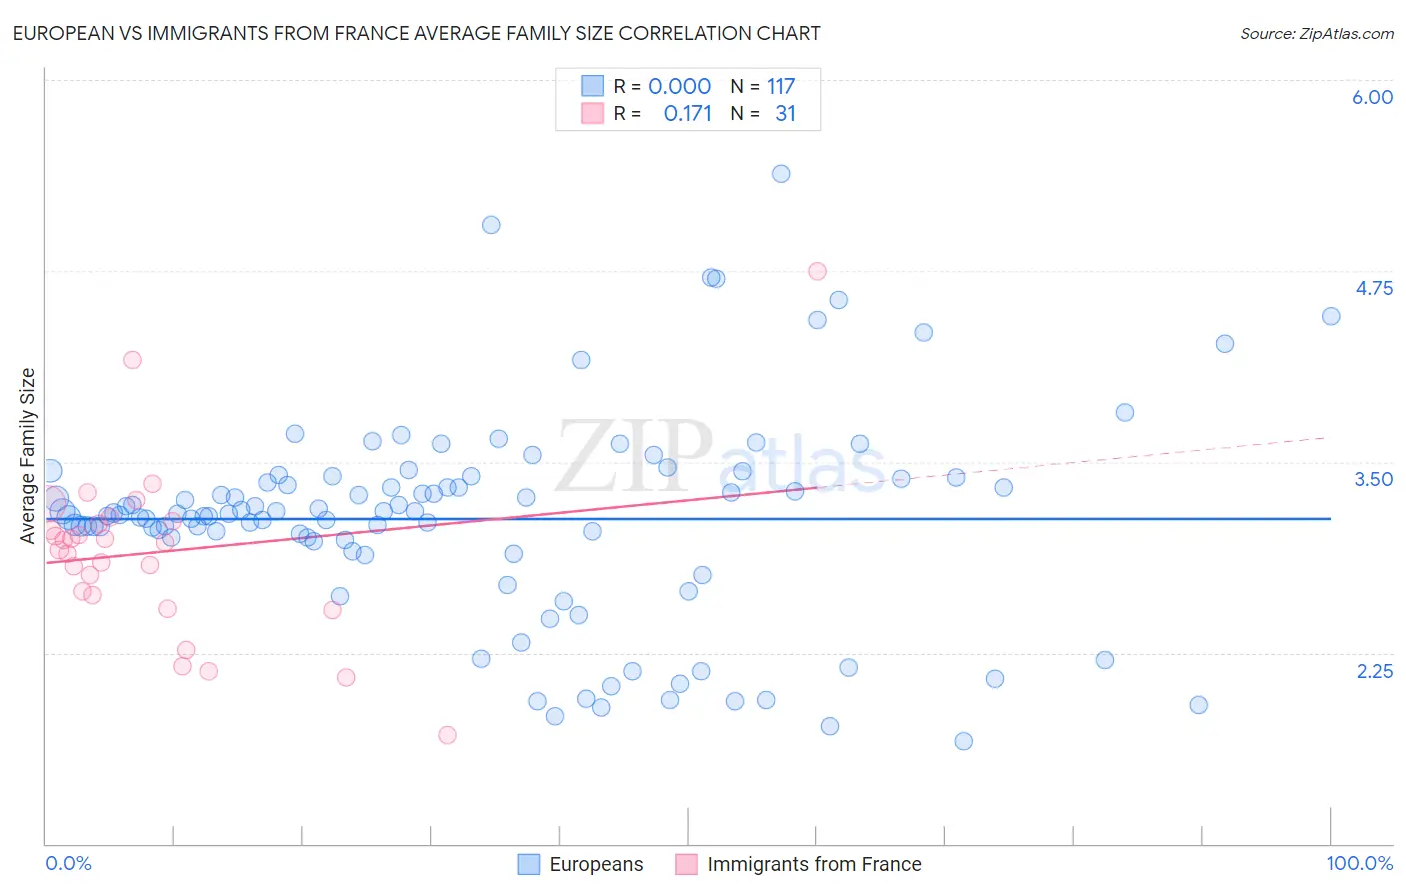
European vs Immigrants from France Average Family Size Correlation Chart
The statistical analysis conducted on geographies consisting of 561,245,179 people shows no correlation between the proportion of Europeans and average family size in the United States with a correlation coefficient (R) of 0.000 and weighted average of 3.14. Similarly, the statistical analysis conducted on geographies consisting of 287,855,925 people shows a poor positive correlation between the proportion of Immigrants from France and average family size in the United States with a correlation coefficient (R) of 0.171 and weighted average of 3.15, a difference of 0.21%.
Average Family Size Correlation Summary
| Measurement | European | Immigrants from France |
| Minimum | 1.67 | 1.71 |
| Maximum | 5.39 | 4.75 |
| Range | 3.72 | 3.04 |
| Mean | 3.13 | 2.91 |
| Median | 3.16 | 2.97 |
| Interquartile 25% (IQ1) | 2.95 | 2.63 |
| Interquartile 75% (IQ3) | 3.40 | 3.11 |
| Interquartile Range (IQR) | 0.45 | 0.48 |
| Standard Deviation (Sample) | 0.68 | 0.57 |
| Standard Deviation (Population) | 0.68 | 0.57 |
Demographics Similar to Europeans and Immigrants from France by Average Family Size
In terms of average family size, the demographic groups most similar to Europeans are Scandinavian (3.14, a difference of 0.010%), Alsatian (3.14, a difference of 0.020%), Immigrants from Croatia (3.14, a difference of 0.030%), Austrian (3.14, a difference of 0.030%), and Ukrainian (3.14, a difference of 0.030%). Similarly, the demographic groups most similar to Immigrants from France are German Russian (3.15, a difference of 0.020%), Yugoslavian (3.15, a difference of 0.030%), Immigrants from Denmark (3.15, a difference of 0.040%), White/Caucasian (3.14, a difference of 0.050%), and Immigrants from England (3.15, a difference of 0.070%).
| Demographics | Rating | Rank | Average Family Size |
| Okinawans | 0.5 /100 | #278 | Tragic 3.15 |
| Immigrants | Europe | 0.5 /100 | #279 | Tragic 3.15 |
| Immigrants | England | 0.4 /100 | #280 | Tragic 3.15 |
| Immigrants | Denmark | 0.4 /100 | #281 | Tragic 3.15 |
| Yugoslavians | 0.4 /100 | #282 | Tragic 3.15 |
| German Russians | 0.4 /100 | #283 | Tragic 3.15 |
| Immigrants | France | 0.4 /100 | #284 | Tragic 3.15 |
| Whites/Caucasians | 0.3 /100 | #285 | Tragic 3.14 |
| Immigrants | Netherlands | 0.3 /100 | #286 | Tragic 3.14 |
| Greeks | 0.3 /100 | #287 | Tragic 3.14 |
| Immigrants | Czechoslovakia | 0.3 /100 | #288 | Tragic 3.14 |
| Immigrants | Norway | 0.3 /100 | #289 | Tragic 3.14 |
| Cypriots | 0.3 /100 | #290 | Tragic 3.14 |
| Alsatians | 0.2 /100 | #291 | Tragic 3.14 |
| Europeans | 0.2 /100 | #292 | Tragic 3.14 |
| Scandinavians | 0.2 /100 | #293 | Tragic 3.14 |
| Immigrants | Croatia | 0.2 /100 | #294 | Tragic 3.14 |
| Austrians | 0.2 /100 | #295 | Tragic 3.14 |
| Ukrainians | 0.2 /100 | #296 | Tragic 3.14 |
| Immigrants | Western Europe | 0.2 /100 | #297 | Tragic 3.14 |
| Colville | 0.2 /100 | #298 | Tragic 3.14 |