Ethiopian vs Greek Female Poverty
COMPARE
Ethiopian
Greek
Female Poverty
Female Poverty Comparison
Ethiopians
Greeks
13.3%
FEMALE POVERTY
62.3/ 100
METRIC RATING
164th/ 347
METRIC RANK
11.7%
FEMALE POVERTY
99.5/ 100
METRIC RATING
30th/ 347
METRIC RANK
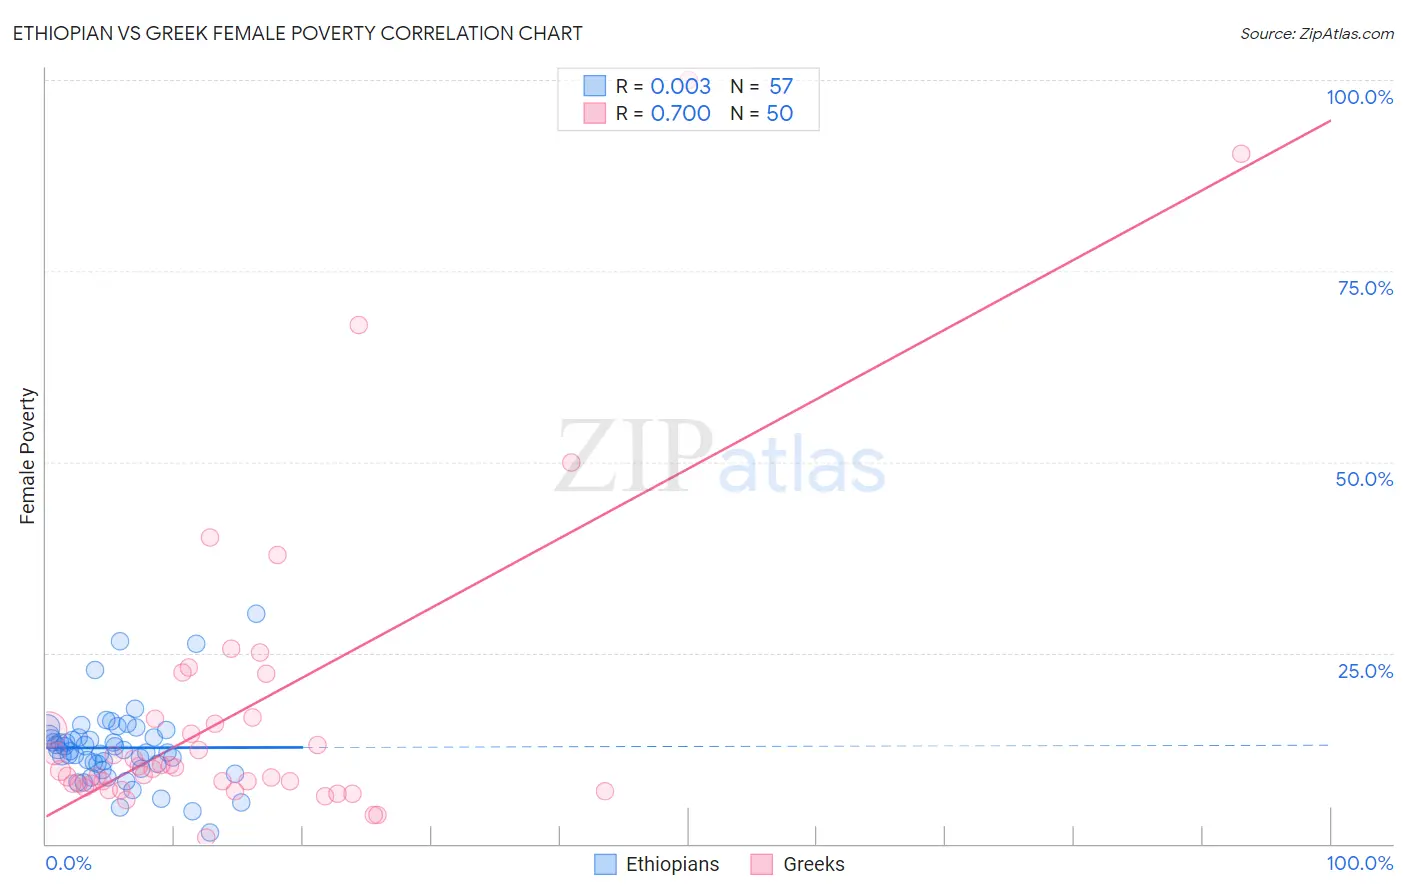
Ethiopian vs Greek Female Poverty Correlation Chart
The statistical analysis conducted on geographies consisting of 223,083,750 people shows no correlation between the proportion of Ethiopians and poverty level among females in the United States with a correlation coefficient (R) of 0.003 and weighted average of 13.3%. Similarly, the statistical analysis conducted on geographies consisting of 482,170,203 people shows a significant positive correlation between the proportion of Greeks and poverty level among females in the United States with a correlation coefficient (R) of 0.700 and weighted average of 11.7%, a difference of 13.5%.
Female Poverty Correlation Summary
| Measurement | Ethiopian | Greek |
| Minimum | 1.5% | 0.85% |
| Maximum | 30.1% | 100.0% |
| Range | 28.6% | 99.2% |
| Mean | 12.6% | 17.3% |
| Median | 12.2% | 9.9% |
| Interquartile 25% (IQ1) | 10.1% | 7.9% |
| Interquartile 75% (IQ3) | 14.1% | 16.3% |
| Interquartile Range (IQR) | 4.0% | 8.5% |
| Standard Deviation (Sample) | 5.0% | 20.2% |
| Standard Deviation (Population) | 5.0% | 20.0% |
Similar Demographics by Female Poverty
Demographics Similar to Ethiopians by Female Poverty
In terms of female poverty, the demographic groups most similar to Ethiopians are Guamanian/Chamorro (13.3%, a difference of 0.010%), Immigrants from Albania (13.3%, a difference of 0.010%), Immigrants from Ethiopia (13.3%, a difference of 0.020%), Scotch-Irish (13.3%, a difference of 0.020%), and Immigrants from Nepal (13.3%, a difference of 0.050%).
| Demographics | Rating | Rank | Female Poverty |
| Immigrants | Northern Africa | 68.8 /100 | #157 | Good 13.2% |
| Pennsylvania Germans | 67.3 /100 | #158 | Good 13.2% |
| Costa Ricans | 63.6 /100 | #159 | Good 13.3% |
| Immigrants | Nepal | 62.7 /100 | #160 | Good 13.3% |
| Immigrants | Ethiopia | 62.5 /100 | #161 | Good 13.3% |
| Guamanians/Chamorros | 62.4 /100 | #162 | Good 13.3% |
| Immigrants | Albania | 62.4 /100 | #163 | Good 13.3% |
| Ethiopians | 62.3 /100 | #164 | Good 13.3% |
| Scotch-Irish | 62.1 /100 | #165 | Good 13.3% |
| Immigrants | Oceania | 59.7 /100 | #166 | Average 13.3% |
| Immigrants | Chile | 57.4 /100 | #167 | Average 13.3% |
| Aleuts | 56.7 /100 | #168 | Average 13.4% |
| Lebanese | 55.9 /100 | #169 | Average 13.4% |
| Colombians | 55.7 /100 | #170 | Average 13.4% |
| Whites/Caucasians | 54.6 /100 | #171 | Average 13.4% |
Demographics Similar to Greeks by Female Poverty
In terms of female poverty, the demographic groups most similar to Greeks are Immigrants from North Macedonia (11.7%, a difference of 0.080%), Polish (11.7%, a difference of 0.22%), Immigrants from Korea (11.7%, a difference of 0.23%), Danish (11.7%, a difference of 0.35%), and Cypriot (11.8%, a difference of 0.42%).
| Demographics | Rating | Rank | Female Poverty |
| Burmese | 99.7 /100 | #23 | Exceptional 11.6% |
| Luxembourgers | 99.7 /100 | #24 | Exceptional 11.6% |
| Immigrants | Northern Europe | 99.6 /100 | #25 | Exceptional 11.6% |
| Croatians | 99.6 /100 | #26 | Exceptional 11.6% |
| Iranians | 99.6 /100 | #27 | Exceptional 11.7% |
| Immigrants | Korea | 99.6 /100 | #28 | Exceptional 11.7% |
| Immigrants | North Macedonia | 99.6 /100 | #29 | Exceptional 11.7% |
| Greeks | 99.5 /100 | #30 | Exceptional 11.7% |
| Poles | 99.5 /100 | #31 | Exceptional 11.7% |
| Danes | 99.5 /100 | #32 | Exceptional 11.7% |
| Cypriots | 99.5 /100 | #33 | Exceptional 11.8% |
| Immigrants | Singapore | 99.4 /100 | #34 | Exceptional 11.8% |
| Immigrants | Iran | 99.4 /100 | #35 | Exceptional 11.8% |
| Immigrants | Pakistan | 99.4 /100 | #36 | Exceptional 11.8% |
| Immigrants | Greece | 99.3 /100 | #37 | Exceptional 11.8% |