English vs German Russian Female Poverty
COMPARE
English
German Russian
Female Poverty
Female Poverty Comparison
English
German Russians
12.4%
FEMALE POVERTY
96.1/ 100
METRIC RATING
89th/ 347
METRIC RANK
14.7%
FEMALE POVERTY
2.0/ 100
METRIC RATING
228th/ 347
METRIC RANK
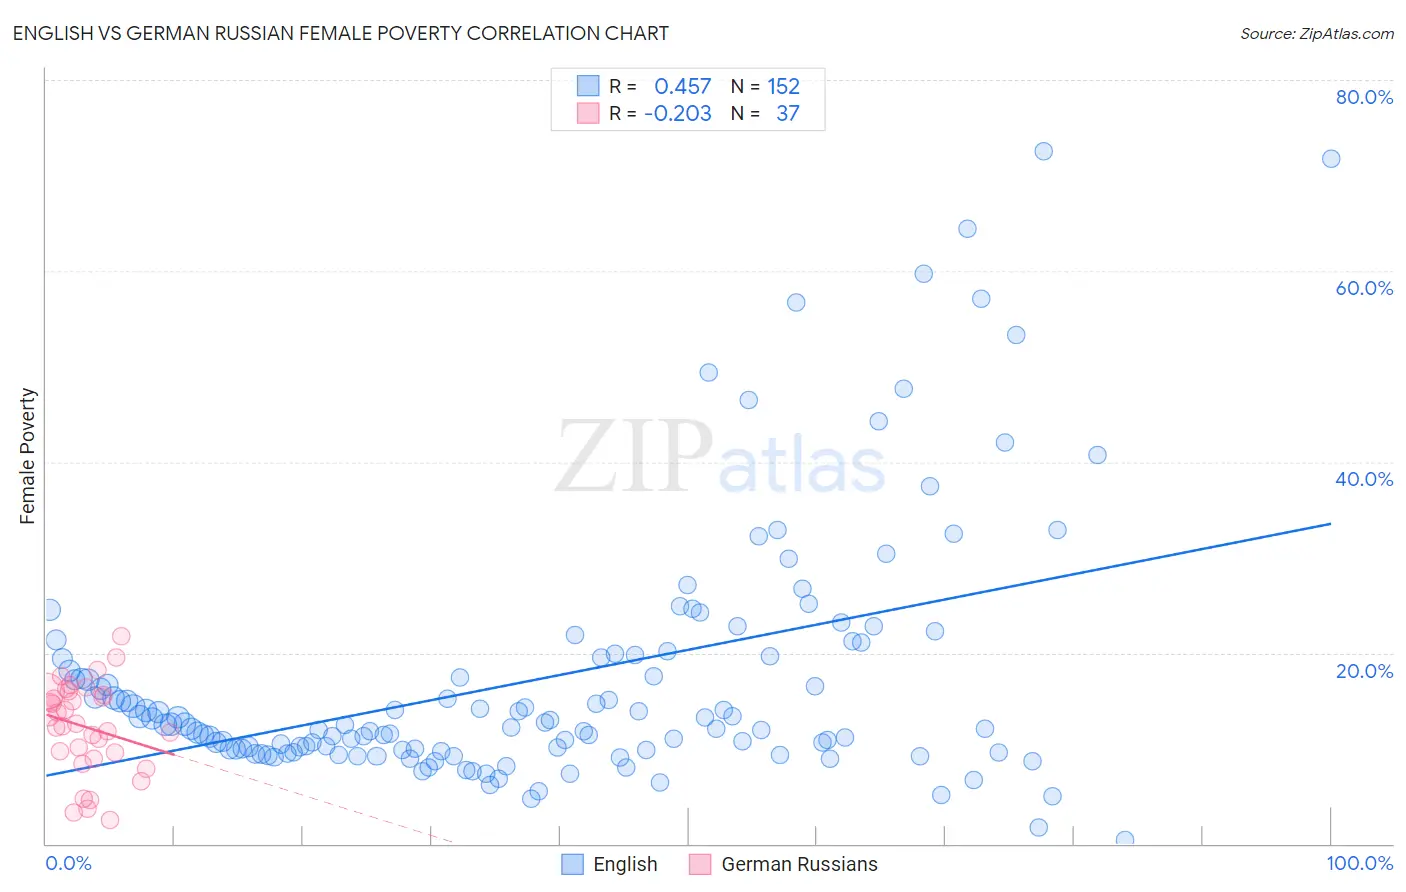
English vs German Russian Female Poverty Correlation Chart
The statistical analysis conducted on geographies consisting of 578,145,061 people shows a moderate positive correlation between the proportion of English and poverty level among females in the United States with a correlation coefficient (R) of 0.457 and weighted average of 12.4%. Similarly, the statistical analysis conducted on geographies consisting of 96,439,432 people shows a weak negative correlation between the proportion of German Russians and poverty level among females in the United States with a correlation coefficient (R) of -0.203 and weighted average of 14.7%, a difference of 18.5%.
Female Poverty Correlation Summary
| Measurement | English | German Russian |
| Minimum | 0.38% | 2.5% |
| Maximum | 72.5% | 21.7% |
| Range | 72.2% | 19.2% |
| Mean | 17.3% | 12.2% |
| Median | 12.4% | 12.6% |
| Interquartile 25% (IQ1) | 9.8% | 9.2% |
| Interquartile 75% (IQ3) | 19.7% | 15.8% |
| Interquartile Range (IQR) | 9.9% | 6.6% |
| Standard Deviation (Sample) | 13.4% | 4.7% |
| Standard Deviation (Population) | 13.3% | 4.7% |
Similar Demographics by Female Poverty
Demographics Similar to English by Female Poverty
In terms of female poverty, the demographic groups most similar to English are Finnish (12.4%, a difference of 0.20%), Immigrants from Denmark (12.4%, a difference of 0.22%), Belgian (12.4%, a difference of 0.23%), Okinawan (12.4%, a difference of 0.24%), and Czechoslovakian (12.4%, a difference of 0.24%).
| Demographics | Rating | Rank | Female Poverty |
| Jordanians | 97.1 /100 | #82 | Exceptional 12.3% |
| Immigrants | England | 96.9 /100 | #83 | Exceptional 12.3% |
| Northern Europeans | 96.6 /100 | #84 | Exceptional 12.4% |
| Irish | 96.5 /100 | #85 | Exceptional 12.4% |
| Dutch | 96.5 /100 | #86 | Exceptional 12.4% |
| Okinawans | 96.4 /100 | #87 | Exceptional 12.4% |
| Finns | 96.4 /100 | #88 | Exceptional 12.4% |
| English | 96.1 /100 | #89 | Exceptional 12.4% |
| Immigrants | Denmark | 95.8 /100 | #90 | Exceptional 12.4% |
| Belgians | 95.8 /100 | #91 | Exceptional 12.4% |
| Czechoslovakians | 95.7 /100 | #92 | Exceptional 12.4% |
| Immigrants | Egypt | 95.5 /100 | #93 | Exceptional 12.5% |
| Immigrants | Indonesia | 95.4 /100 | #94 | Exceptional 12.5% |
| Immigrants | South Africa | 95.4 /100 | #95 | Exceptional 12.5% |
| British | 95.2 /100 | #96 | Exceptional 12.5% |
Demographics Similar to German Russians by Female Poverty
In terms of female poverty, the demographic groups most similar to German Russians are Ghanaian (14.7%, a difference of 0.060%), Immigrants from Nigeria (14.7%, a difference of 0.15%), Alaska Native (14.7%, a difference of 0.27%), Nigerian (14.8%, a difference of 0.36%), and Immigrants from Eritrea (14.6%, a difference of 0.45%).
| Demographics | Rating | Rank | Female Poverty |
| Immigrants | Cambodia | 3.7 /100 | #221 | Tragic 14.5% |
| Immigrants | Nonimmigrants | 3.7 /100 | #222 | Tragic 14.5% |
| Immigrants | Africa | 3.3 /100 | #223 | Tragic 14.5% |
| Americans | 2.8 /100 | #224 | Tragic 14.6% |
| Immigrants | Micronesia | 2.8 /100 | #225 | Tragic 14.6% |
| Immigrants | Eritrea | 2.4 /100 | #226 | Tragic 14.6% |
| Immigrants | Nigeria | 2.1 /100 | #227 | Tragic 14.7% |
| German Russians | 2.0 /100 | #228 | Tragic 14.7% |
| Ghanaians | 1.9 /100 | #229 | Tragic 14.7% |
| Alaska Natives | 1.8 /100 | #230 | Tragic 14.7% |
| Nigerians | 1.7 /100 | #231 | Tragic 14.8% |
| Osage | 1.5 /100 | #232 | Tragic 14.8% |
| Immigrants | Saudi Arabia | 1.4 /100 | #233 | Tragic 14.8% |
| Fijians | 1.1 /100 | #234 | Tragic 14.9% |
| Immigrants | Laos | 0.9 /100 | #235 | Tragic 15.0% |