English vs Immigrants from Cameroon Female Poverty
COMPARE
English
Immigrants from Cameroon
Female Poverty
Female Poverty Comparison
English
Immigrants from Cameroon
12.4%
FEMALE POVERTY
96.1/ 100
METRIC RATING
89th/ 347
METRIC RANK
13.5%
FEMALE POVERTY
42.0/ 100
METRIC RATING
185th/ 347
METRIC RANK
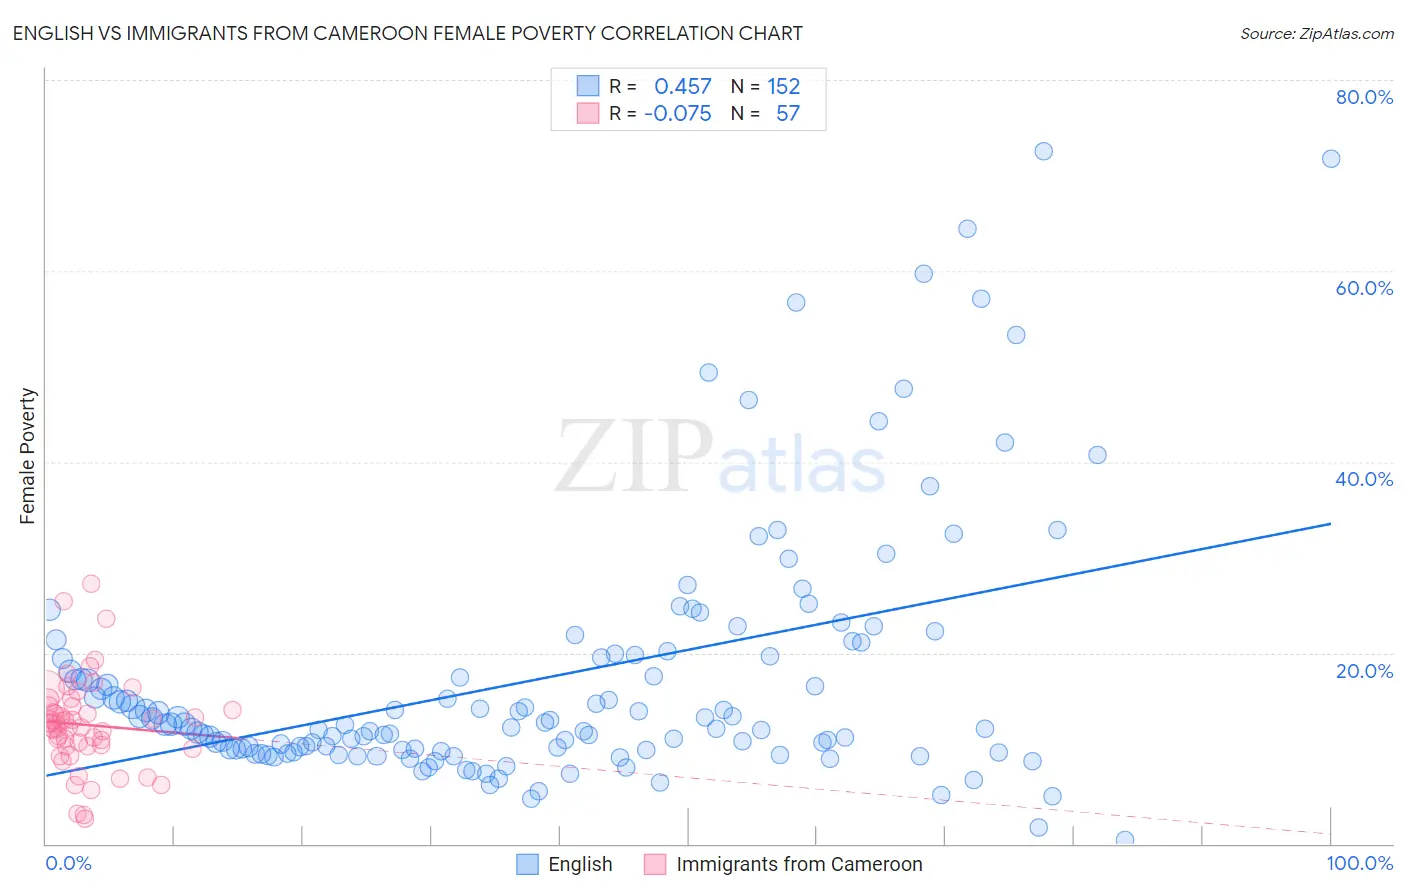
English vs Immigrants from Cameroon Female Poverty Correlation Chart
The statistical analysis conducted on geographies consisting of 578,145,061 people shows a moderate positive correlation between the proportion of English and poverty level among females in the United States with a correlation coefficient (R) of 0.457 and weighted average of 12.4%. Similarly, the statistical analysis conducted on geographies consisting of 130,715,237 people shows a slight negative correlation between the proportion of Immigrants from Cameroon and poverty level among females in the United States with a correlation coefficient (R) of -0.075 and weighted average of 13.5%, a difference of 9.2%.
Female Poverty Correlation Summary
| Measurement | English | Immigrants from Cameroon |
| Minimum | 0.38% | 2.6% |
| Maximum | 72.5% | 27.2% |
| Range | 72.2% | 24.6% |
| Mean | 17.3% | 12.5% |
| Median | 12.4% | 12.5% |
| Interquartile 25% (IQ1) | 9.8% | 10.2% |
| Interquartile 75% (IQ3) | 19.7% | 14.4% |
| Interquartile Range (IQR) | 9.9% | 4.2% |
| Standard Deviation (Sample) | 13.4% | 4.8% |
| Standard Deviation (Population) | 13.3% | 4.8% |
Similar Demographics by Female Poverty
Demographics Similar to English by Female Poverty
In terms of female poverty, the demographic groups most similar to English are Finnish (12.4%, a difference of 0.20%), Immigrants from Denmark (12.4%, a difference of 0.22%), Belgian (12.4%, a difference of 0.23%), Okinawan (12.4%, a difference of 0.24%), and Czechoslovakian (12.4%, a difference of 0.24%).
| Demographics | Rating | Rank | Female Poverty |
| Jordanians | 97.1 /100 | #82 | Exceptional 12.3% |
| Immigrants | England | 96.9 /100 | #83 | Exceptional 12.3% |
| Northern Europeans | 96.6 /100 | #84 | Exceptional 12.4% |
| Irish | 96.5 /100 | #85 | Exceptional 12.4% |
| Dutch | 96.5 /100 | #86 | Exceptional 12.4% |
| Okinawans | 96.4 /100 | #87 | Exceptional 12.4% |
| Finns | 96.4 /100 | #88 | Exceptional 12.4% |
| English | 96.1 /100 | #89 | Exceptional 12.4% |
| Immigrants | Denmark | 95.8 /100 | #90 | Exceptional 12.4% |
| Belgians | 95.8 /100 | #91 | Exceptional 12.4% |
| Czechoslovakians | 95.7 /100 | #92 | Exceptional 12.4% |
| Immigrants | Egypt | 95.5 /100 | #93 | Exceptional 12.5% |
| Immigrants | Indonesia | 95.4 /100 | #94 | Exceptional 12.5% |
| Immigrants | South Africa | 95.4 /100 | #95 | Exceptional 12.5% |
| British | 95.2 /100 | #96 | Exceptional 12.5% |
Demographics Similar to Immigrants from Cameroon by Female Poverty
In terms of female poverty, the demographic groups most similar to Immigrants from Cameroon are Immigrants from Portugal (13.6%, a difference of 0.060%), Immigrants from Sierra Leone (13.5%, a difference of 0.11%), Immigrants from Venezuela (13.6%, a difference of 0.11%), Kenyan (13.5%, a difference of 0.17%), and Hawaiian (13.6%, a difference of 0.21%).
| Demographics | Rating | Rank | Female Poverty |
| Israelis | 49.1 /100 | #178 | Average 13.5% |
| Immigrants | Syria | 48.8 /100 | #179 | Average 13.5% |
| South Americans | 44.8 /100 | #180 | Average 13.5% |
| Venezuelans | 44.5 /100 | #181 | Average 13.5% |
| Immigrants | Colombia | 44.5 /100 | #182 | Average 13.5% |
| Kenyans | 43.8 /100 | #183 | Average 13.5% |
| Immigrants | Sierra Leone | 43.2 /100 | #184 | Average 13.5% |
| Immigrants | Cameroon | 42.0 /100 | #185 | Average 13.5% |
| Immigrants | Portugal | 41.5 /100 | #186 | Average 13.6% |
| Immigrants | Venezuela | 41.0 /100 | #187 | Average 13.6% |
| Hawaiians | 39.9 /100 | #188 | Fair 13.6% |
| Uruguayans | 39.8 /100 | #189 | Fair 13.6% |
| Sierra Leoneans | 33.1 /100 | #190 | Fair 13.7% |
| Immigrants | Kuwait | 32.7 /100 | #191 | Fair 13.7% |
| Immigrants | Costa Rica | 31.9 /100 | #192 | Fair 13.7% |