English vs Immigrants from Cameroon 3rd Grade
COMPARE
English
Immigrants from Cameroon
3rd Grade
3rd Grade Comparison
English
Immigrants from Cameroon
98.6%
3RD GRADE
100.0/ 100
METRIC RATING
12th/ 347
METRIC RANK
97.2%
3RD GRADE
0.1/ 100
METRIC RATING
274th/ 347
METRIC RANK
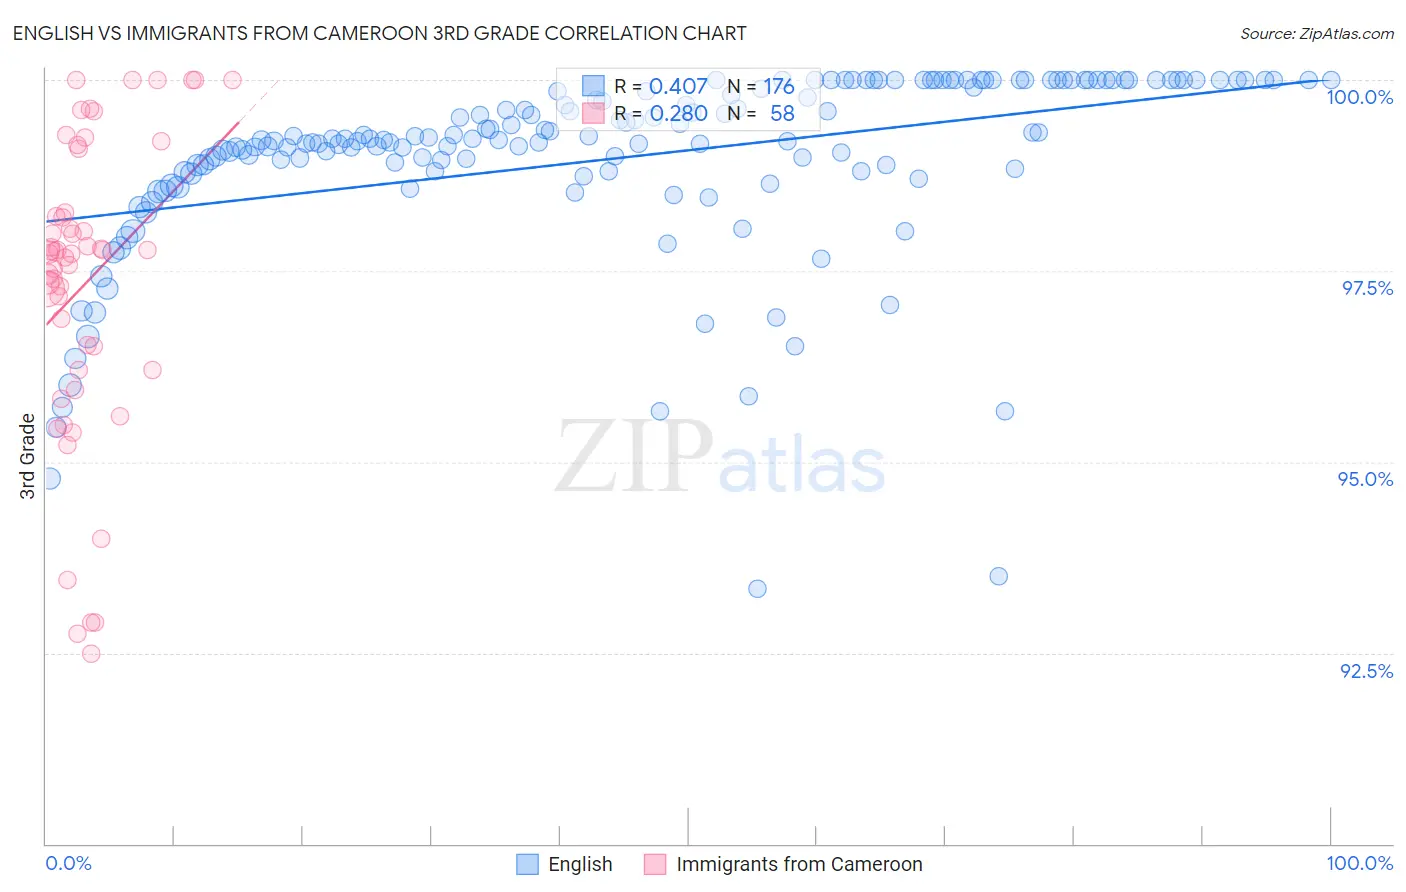
English vs Immigrants from Cameroon 3rd Grade Correlation Chart
The statistical analysis conducted on geographies consisting of 579,981,412 people shows a moderate positive correlation between the proportion of English and percentage of population with at least 3rd grade education in the United States with a correlation coefficient (R) of 0.407 and weighted average of 98.6%. Similarly, the statistical analysis conducted on geographies consisting of 130,752,798 people shows a weak positive correlation between the proportion of Immigrants from Cameroon and percentage of population with at least 3rd grade education in the United States with a correlation coefficient (R) of 0.280 and weighted average of 97.2%, a difference of 1.4%.
3rd Grade Correlation Summary
| Measurement | English | Immigrants from Cameroon |
| Minimum | 93.3% | 92.5% |
| Maximum | 100.0% | 100.0% |
| Range | 6.7% | 7.5% |
| Mean | 99.0% | 97.3% |
| Median | 99.2% | 97.7% |
| Interquartile 25% (IQ1) | 98.8% | 96.2% |
| Interquartile 75% (IQ3) | 100.0% | 98.3% |
| Interquartile Range (IQR) | 1.2% | 2.1% |
| Standard Deviation (Sample) | 1.2% | 2.0% |
| Standard Deviation (Population) | 1.2% | 1.9% |
Similar Demographics by 3rd Grade
Demographics Similar to English by 3rd Grade
In terms of 3rd grade, the demographic groups most similar to English are Tlingit-Haida (98.5%, a difference of 0.0%), Carpatho Rusyn (98.5%, a difference of 0.0%), Swedish (98.5%, a difference of 0.010%), Alaska Native (98.6%, a difference of 0.020%), and Slovene (98.6%, a difference of 0.020%).
| Demographics | Rating | Rank | 3rd Grade |
| Tsimshian | 100.0 /100 | #5 | Exceptional 98.8% |
| Alaskan Athabascans | 100.0 /100 | #6 | Exceptional 98.7% |
| Norwegians | 100.0 /100 | #7 | Exceptional 98.6% |
| Slovaks | 100.0 /100 | #8 | Exceptional 98.6% |
| Germans | 100.0 /100 | #9 | Exceptional 98.6% |
| Alaska Natives | 100.0 /100 | #10 | Exceptional 98.6% |
| Slovenes | 100.0 /100 | #11 | Exceptional 98.6% |
| English | 100.0 /100 | #12 | Exceptional 98.6% |
| Tlingit-Haida | 100.0 /100 | #13 | Exceptional 98.5% |
| Carpatho Rusyns | 100.0 /100 | #14 | Exceptional 98.5% |
| Swedes | 100.0 /100 | #15 | Exceptional 98.5% |
| Scottish | 100.0 /100 | #16 | Exceptional 98.5% |
| Dutch | 100.0 /100 | #17 | Exceptional 98.5% |
| Irish | 100.0 /100 | #18 | Exceptional 98.5% |
| Poles | 100.0 /100 | #19 | Exceptional 98.5% |
Demographics Similar to Immigrants from Cameroon by 3rd Grade
In terms of 3rd grade, the demographic groups most similar to Immigrants from Cameroon are Immigrants from China (97.2%, a difference of 0.010%), Puerto Rican (97.2%, a difference of 0.010%), Ghanaian (97.2%, a difference of 0.010%), Immigrants from Peru (97.2%, a difference of 0.010%), and Immigrants from Uzbekistan (97.2%, a difference of 0.020%).
| Demographics | Rating | Rank | 3rd Grade |
| Immigrants | Nigeria | 0.3 /100 | #267 | Tragic 97.3% |
| Cubans | 0.2 /100 | #268 | Tragic 97.3% |
| Fijians | 0.2 /100 | #269 | Tragic 97.3% |
| Immigrants | China | 0.2 /100 | #270 | Tragic 97.2% |
| Puerto Ricans | 0.2 /100 | #271 | Tragic 97.2% |
| Ghanaians | 0.1 /100 | #272 | Tragic 97.2% |
| Immigrants | Peru | 0.1 /100 | #273 | Tragic 97.2% |
| Immigrants | Cameroon | 0.1 /100 | #274 | Tragic 97.2% |
| Immigrants | Uzbekistan | 0.1 /100 | #275 | Tragic 97.2% |
| Immigrants | Bolivia | 0.1 /100 | #276 | Tragic 97.2% |
| Trinidadians and Tobagonians | 0.1 /100 | #277 | Tragic 97.2% |
| Immigrants | Western Africa | 0.1 /100 | #278 | Tragic 97.2% |
| Immigrants | Philippines | 0.1 /100 | #279 | Tragic 97.2% |
| Immigrants | Ghana | 0.1 /100 | #280 | Tragic 97.2% |
| Barbadians | 0.1 /100 | #281 | Tragic 97.2% |