English vs Immigrants from Cameroon Ambulatory Disability
COMPARE
English
Immigrants from Cameroon
Ambulatory Disability
Ambulatory Disability Comparison
English
Immigrants from Cameroon
6.6%
AMBULATORY DISABILITY
0.4/ 100
METRIC RATING
262nd/ 347
METRIC RANK
5.7%
AMBULATORY DISABILITY
99.4/ 100
METRIC RATING
74th/ 347
METRIC RANK
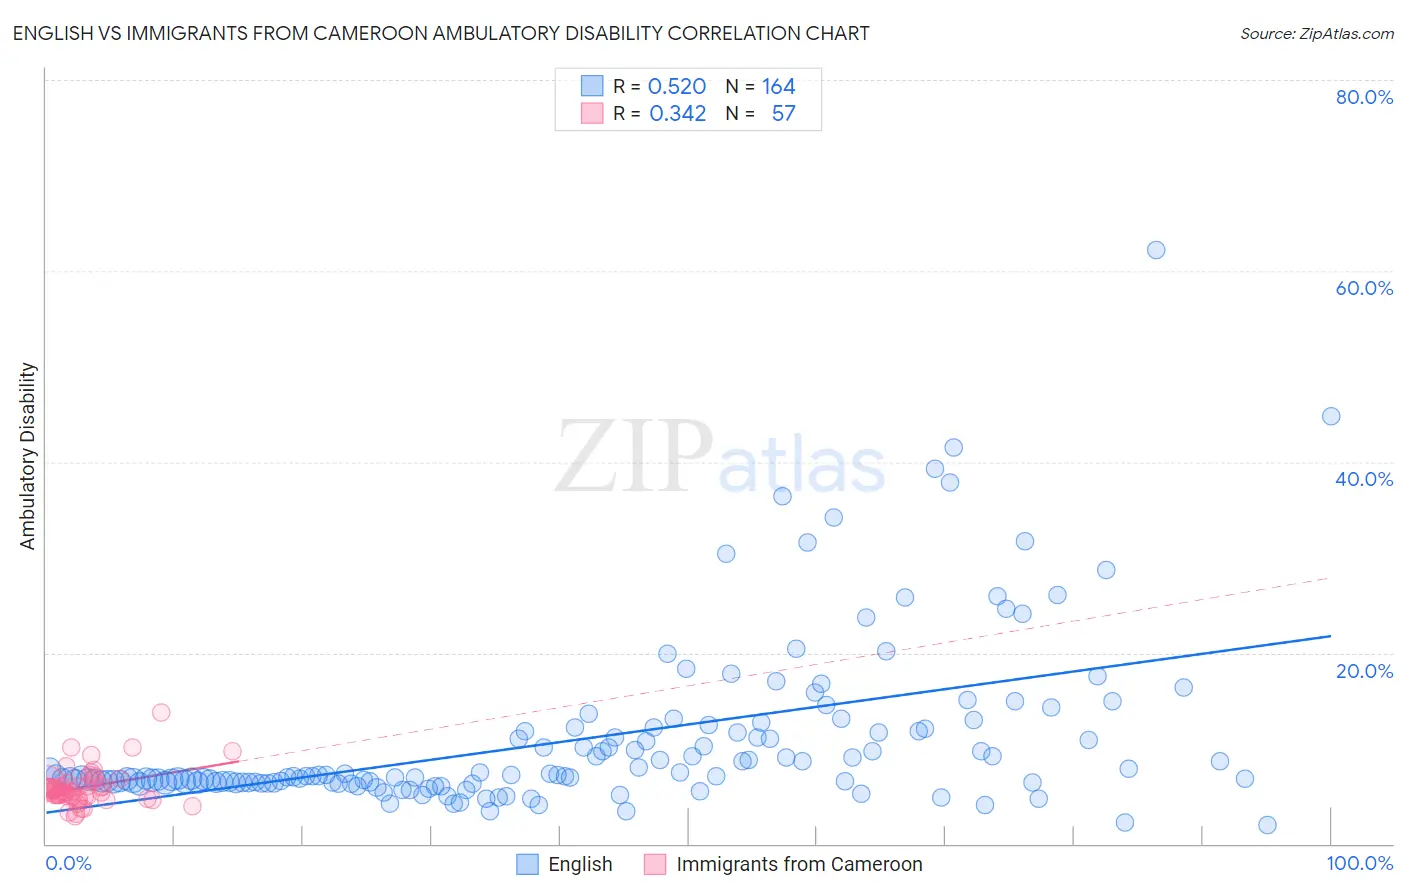
English vs Immigrants from Cameroon Ambulatory Disability Correlation Chart
The statistical analysis conducted on geographies consisting of 579,179,335 people shows a substantial positive correlation between the proportion of English and percentage of population with ambulatory disability in the United States with a correlation coefficient (R) of 0.520 and weighted average of 6.6%. Similarly, the statistical analysis conducted on geographies consisting of 130,739,199 people shows a mild positive correlation between the proportion of Immigrants from Cameroon and percentage of population with ambulatory disability in the United States with a correlation coefficient (R) of 0.342 and weighted average of 5.7%, a difference of 15.2%.
Ambulatory Disability Correlation Summary
| Measurement | English | Immigrants from Cameroon |
| Minimum | 2.0% | 2.9% |
| Maximum | 62.2% | 13.7% |
| Range | 60.2% | 10.8% |
| Mean | 11.0% | 5.9% |
| Median | 7.1% | 5.6% |
| Interquartile 25% (IQ1) | 6.4% | 5.0% |
| Interquartile 75% (IQ3) | 11.9% | 6.2% |
| Interquartile Range (IQR) | 5.5% | 1.2% |
| Standard Deviation (Sample) | 9.0% | 1.9% |
| Standard Deviation (Population) | 8.9% | 1.8% |
Similar Demographics by Ambulatory Disability
Demographics Similar to English by Ambulatory Disability
In terms of ambulatory disability, the demographic groups most similar to English are Hmong (6.6%, a difference of 0.12%), Irish (6.6%, a difference of 0.17%), Immigrants from Belize (6.6%, a difference of 0.24%), Aleut (6.6%, a difference of 0.25%), and Spanish American Indian (6.5%, a difference of 0.43%).
| Demographics | Rating | Rank | Ambulatory Disability |
| Welsh | 0.6 /100 | #255 | Tragic 6.5% |
| Immigrants | Uzbekistan | 0.6 /100 | #256 | Tragic 6.5% |
| Bermudans | 0.5 /100 | #257 | Tragic 6.5% |
| Spanish American Indians | 0.5 /100 | #258 | Tragic 6.5% |
| Aleuts | 0.4 /100 | #259 | Tragic 6.6% |
| Immigrants | Belize | 0.4 /100 | #260 | Tragic 6.6% |
| Irish | 0.4 /100 | #261 | Tragic 6.6% |
| English | 0.4 /100 | #262 | Tragic 6.6% |
| Hmong | 0.3 /100 | #263 | Tragic 6.6% |
| Nepalese | 0.2 /100 | #264 | Tragic 6.6% |
| Bahamians | 0.2 /100 | #265 | Tragic 6.6% |
| Guyanese | 0.2 /100 | #266 | Tragic 6.6% |
| Trinidadians and Tobagonians | 0.2 /100 | #267 | Tragic 6.6% |
| Spanish | 0.2 /100 | #268 | Tragic 6.6% |
| French | 0.1 /100 | #269 | Tragic 6.6% |
Demographics Similar to Immigrants from Cameroon by Ambulatory Disability
In terms of ambulatory disability, the demographic groups most similar to Immigrants from Cameroon are Immigrants from Northern Africa (5.7%, a difference of 0.010%), Brazilian (5.7%, a difference of 0.020%), Immigrants from Peru (5.7%, a difference of 0.040%), Immigrants from South Africa (5.7%, a difference of 0.050%), and Sudanese (5.7%, a difference of 0.070%).
| Demographics | Rating | Rank | Ambulatory Disability |
| Immigrants | Uganda | 99.6 /100 | #67 | Exceptional 5.7% |
| Sri Lankans | 99.6 /100 | #68 | Exceptional 5.7% |
| Peruvians | 99.5 /100 | #69 | Exceptional 5.7% |
| Sierra Leoneans | 99.4 /100 | #70 | Exceptional 5.7% |
| Immigrants | Peru | 99.4 /100 | #71 | Exceptional 5.7% |
| Brazilians | 99.4 /100 | #72 | Exceptional 5.7% |
| Immigrants | Northern Africa | 99.4 /100 | #73 | Exceptional 5.7% |
| Immigrants | Cameroon | 99.4 /100 | #74 | Exceptional 5.7% |
| Immigrants | South Africa | 99.3 /100 | #75 | Exceptional 5.7% |
| Sudanese | 99.3 /100 | #76 | Exceptional 5.7% |
| Immigrants | Vietnam | 99.3 /100 | #77 | Exceptional 5.7% |
| Somalis | 99.2 /100 | #78 | Exceptional 5.7% |
| Chileans | 99.2 /100 | #79 | Exceptional 5.7% |
| Immigrants | Ireland | 99.2 /100 | #80 | Exceptional 5.7% |
| Immigrants | Jordan | 99.2 /100 | #81 | Exceptional 5.7% |