Immigrants from Cameroon vs German Russian Female Poverty
COMPARE
Immigrants from Cameroon
German Russian
Female Poverty
Female Poverty Comparison
Immigrants from Cameroon
German Russians
13.5%
FEMALE POVERTY
42.0/ 100
METRIC RATING
185th/ 347
METRIC RANK
14.7%
FEMALE POVERTY
2.0/ 100
METRIC RATING
228th/ 347
METRIC RANK
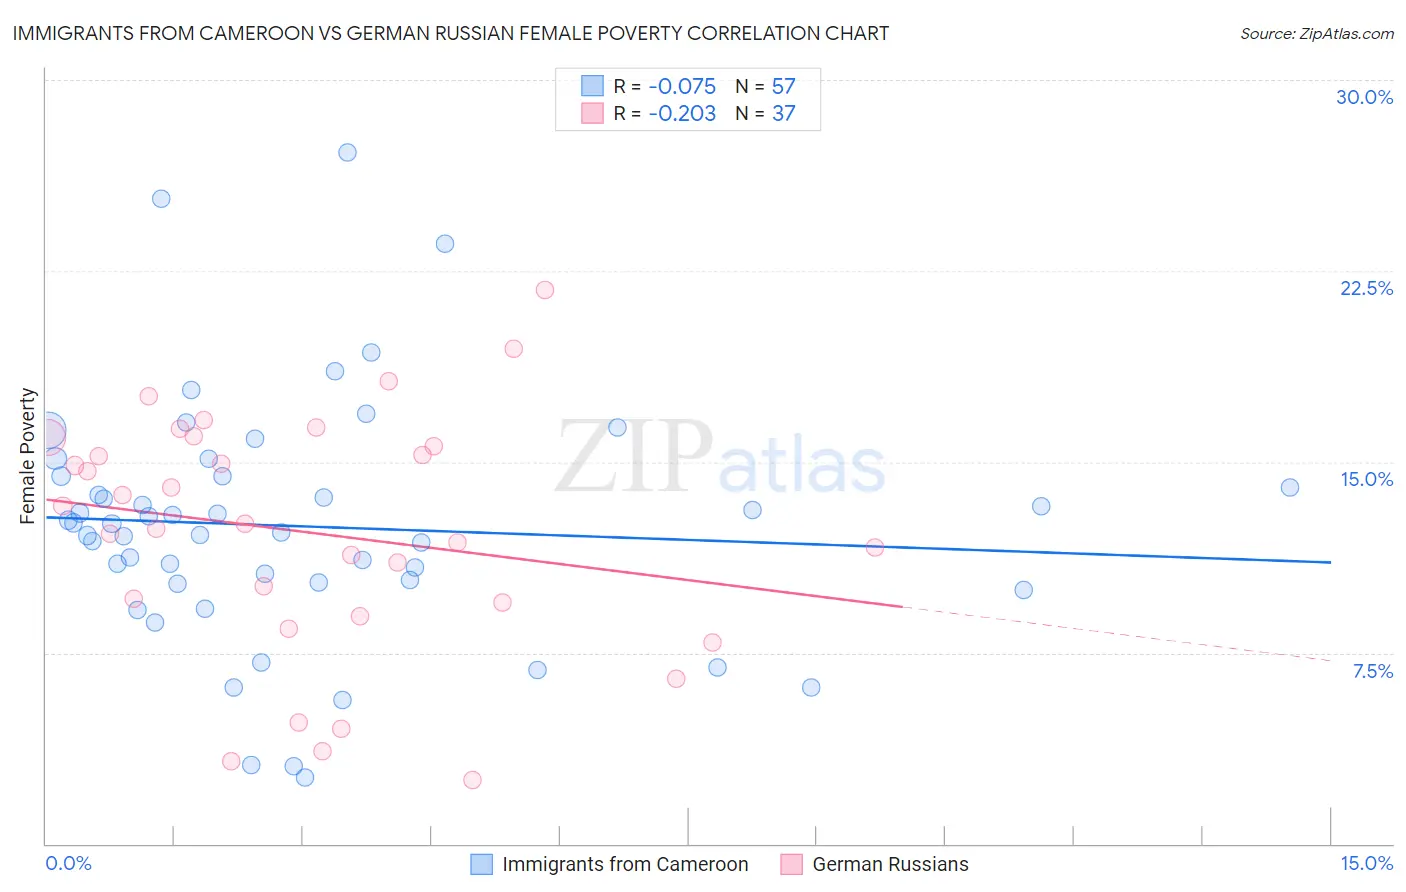
Immigrants from Cameroon vs German Russian Female Poverty Correlation Chart
The statistical analysis conducted on geographies consisting of 130,715,237 people shows a slight negative correlation between the proportion of Immigrants from Cameroon and poverty level among females in the United States with a correlation coefficient (R) of -0.075 and weighted average of 13.5%. Similarly, the statistical analysis conducted on geographies consisting of 96,439,432 people shows a weak negative correlation between the proportion of German Russians and poverty level among females in the United States with a correlation coefficient (R) of -0.203 and weighted average of 14.7%, a difference of 8.6%.
Female Poverty Correlation Summary
| Measurement | Immigrants from Cameroon | German Russian |
| Minimum | 2.6% | 2.5% |
| Maximum | 27.2% | 21.7% |
| Range | 24.6% | 19.2% |
| Mean | 12.5% | 12.2% |
| Median | 12.5% | 12.6% |
| Interquartile 25% (IQ1) | 10.2% | 9.2% |
| Interquartile 75% (IQ3) | 14.4% | 15.8% |
| Interquartile Range (IQR) | 4.2% | 6.6% |
| Standard Deviation (Sample) | 4.8% | 4.7% |
| Standard Deviation (Population) | 4.8% | 4.7% |
Similar Demographics by Female Poverty
Demographics Similar to Immigrants from Cameroon by Female Poverty
In terms of female poverty, the demographic groups most similar to Immigrants from Cameroon are Immigrants from Portugal (13.6%, a difference of 0.060%), Immigrants from Sierra Leone (13.5%, a difference of 0.11%), Immigrants from Venezuela (13.6%, a difference of 0.11%), Kenyan (13.5%, a difference of 0.17%), and Hawaiian (13.6%, a difference of 0.21%).
| Demographics | Rating | Rank | Female Poverty |
| Israelis | 49.1 /100 | #178 | Average 13.5% |
| Immigrants | Syria | 48.8 /100 | #179 | Average 13.5% |
| South Americans | 44.8 /100 | #180 | Average 13.5% |
| Venezuelans | 44.5 /100 | #181 | Average 13.5% |
| Immigrants | Colombia | 44.5 /100 | #182 | Average 13.5% |
| Kenyans | 43.8 /100 | #183 | Average 13.5% |
| Immigrants | Sierra Leone | 43.2 /100 | #184 | Average 13.5% |
| Immigrants | Cameroon | 42.0 /100 | #185 | Average 13.5% |
| Immigrants | Portugal | 41.5 /100 | #186 | Average 13.6% |
| Immigrants | Venezuela | 41.0 /100 | #187 | Average 13.6% |
| Hawaiians | 39.9 /100 | #188 | Fair 13.6% |
| Uruguayans | 39.8 /100 | #189 | Fair 13.6% |
| Sierra Leoneans | 33.1 /100 | #190 | Fair 13.7% |
| Immigrants | Kuwait | 32.7 /100 | #191 | Fair 13.7% |
| Immigrants | Costa Rica | 31.9 /100 | #192 | Fair 13.7% |
Demographics Similar to German Russians by Female Poverty
In terms of female poverty, the demographic groups most similar to German Russians are Ghanaian (14.7%, a difference of 0.060%), Immigrants from Nigeria (14.7%, a difference of 0.15%), Alaska Native (14.7%, a difference of 0.27%), Nigerian (14.8%, a difference of 0.36%), and Immigrants from Eritrea (14.6%, a difference of 0.45%).
| Demographics | Rating | Rank | Female Poverty |
| Immigrants | Cambodia | 3.7 /100 | #221 | Tragic 14.5% |
| Immigrants | Nonimmigrants | 3.7 /100 | #222 | Tragic 14.5% |
| Immigrants | Africa | 3.3 /100 | #223 | Tragic 14.5% |
| Americans | 2.8 /100 | #224 | Tragic 14.6% |
| Immigrants | Micronesia | 2.8 /100 | #225 | Tragic 14.6% |
| Immigrants | Eritrea | 2.4 /100 | #226 | Tragic 14.6% |
| Immigrants | Nigeria | 2.1 /100 | #227 | Tragic 14.7% |
| German Russians | 2.0 /100 | #228 | Tragic 14.7% |
| Ghanaians | 1.9 /100 | #229 | Tragic 14.7% |
| Alaska Natives | 1.8 /100 | #230 | Tragic 14.7% |
| Nigerians | 1.7 /100 | #231 | Tragic 14.8% |
| Osage | 1.5 /100 | #232 | Tragic 14.8% |
| Immigrants | Saudi Arabia | 1.4 /100 | #233 | Tragic 14.8% |
| Fijians | 1.1 /100 | #234 | Tragic 14.9% |
| Immigrants | Laos | 0.9 /100 | #235 | Tragic 15.0% |