English vs German Russian Ambulatory Disability
COMPARE
English
German Russian
Ambulatory Disability
Ambulatory Disability Comparison
English
German Russians
6.6%
AMBULATORY DISABILITY
0.4/ 100
METRIC RATING
262nd/ 347
METRIC RANK
6.3%
AMBULATORY DISABILITY
9.4/ 100
METRIC RATING
222nd/ 347
METRIC RANK
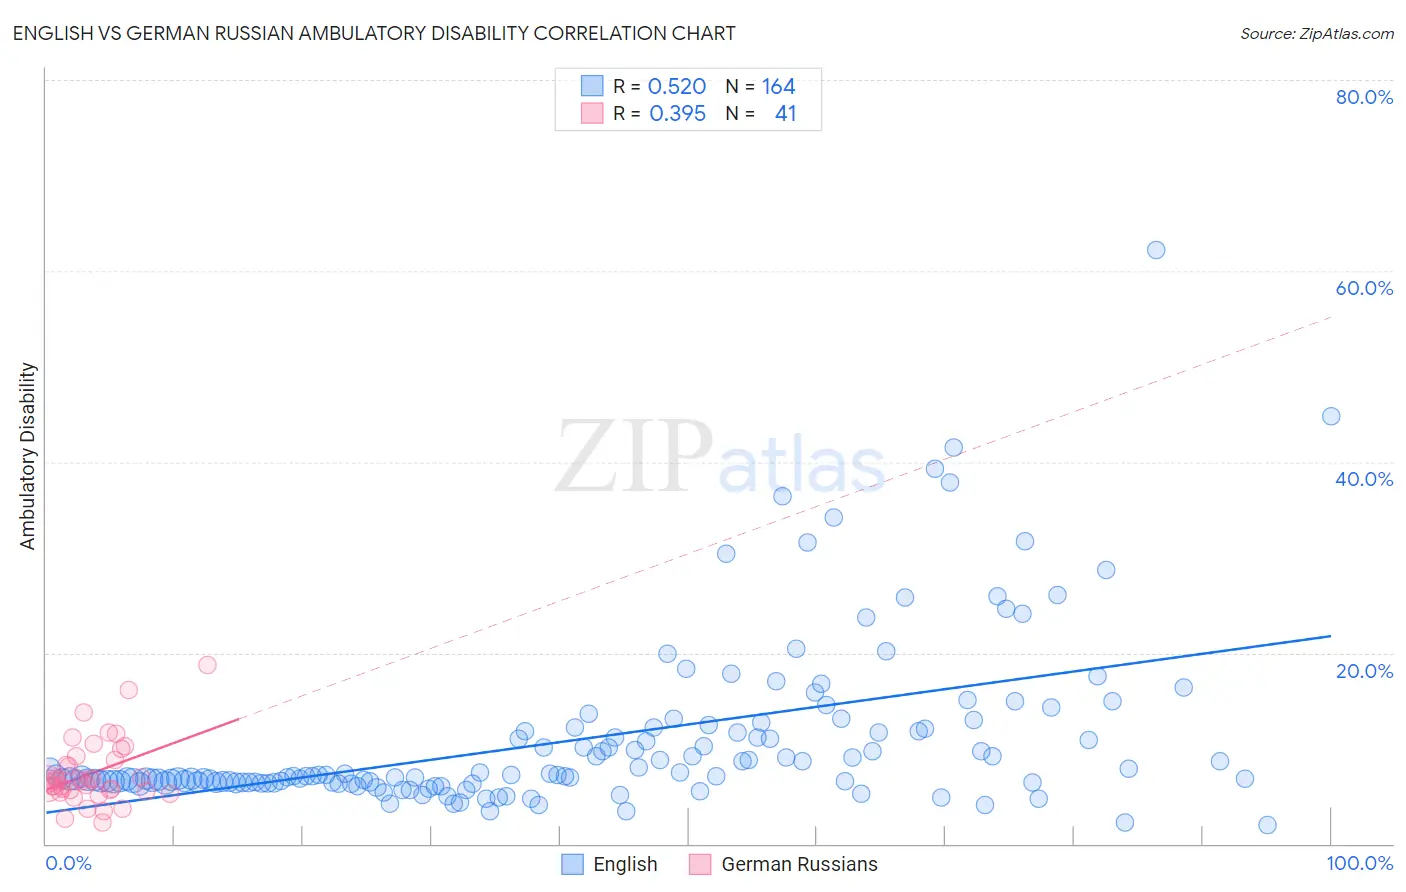
English vs German Russian Ambulatory Disability Correlation Chart
The statistical analysis conducted on geographies consisting of 579,179,335 people shows a substantial positive correlation between the proportion of English and percentage of population with ambulatory disability in the United States with a correlation coefficient (R) of 0.520 and weighted average of 6.6%. Similarly, the statistical analysis conducted on geographies consisting of 96,455,793 people shows a mild positive correlation between the proportion of German Russians and percentage of population with ambulatory disability in the United States with a correlation coefficient (R) of 0.395 and weighted average of 6.3%, a difference of 4.3%.
Ambulatory Disability Correlation Summary
| Measurement | English | German Russian |
| Minimum | 2.0% | 2.3% |
| Maximum | 62.2% | 18.8% |
| Range | 60.2% | 16.5% |
| Mean | 11.0% | 7.4% |
| Median | 7.1% | 6.5% |
| Interquartile 25% (IQ1) | 6.4% | 5.6% |
| Interquartile 75% (IQ3) | 11.9% | 9.0% |
| Interquartile Range (IQR) | 5.5% | 3.4% |
| Standard Deviation (Sample) | 9.0% | 3.4% |
| Standard Deviation (Population) | 8.9% | 3.4% |
Similar Demographics by Ambulatory Disability
Demographics Similar to English by Ambulatory Disability
In terms of ambulatory disability, the demographic groups most similar to English are Hmong (6.6%, a difference of 0.12%), Irish (6.6%, a difference of 0.17%), Immigrants from Belize (6.6%, a difference of 0.24%), Aleut (6.6%, a difference of 0.25%), and Spanish American Indian (6.5%, a difference of 0.43%).
| Demographics | Rating | Rank | Ambulatory Disability |
| Welsh | 0.6 /100 | #255 | Tragic 6.5% |
| Immigrants | Uzbekistan | 0.6 /100 | #256 | Tragic 6.5% |
| Bermudans | 0.5 /100 | #257 | Tragic 6.5% |
| Spanish American Indians | 0.5 /100 | #258 | Tragic 6.5% |
| Aleuts | 0.4 /100 | #259 | Tragic 6.6% |
| Immigrants | Belize | 0.4 /100 | #260 | Tragic 6.6% |
| Irish | 0.4 /100 | #261 | Tragic 6.6% |
| English | 0.4 /100 | #262 | Tragic 6.6% |
| Hmong | 0.3 /100 | #263 | Tragic 6.6% |
| Nepalese | 0.2 /100 | #264 | Tragic 6.6% |
| Bahamians | 0.2 /100 | #265 | Tragic 6.6% |
| Guyanese | 0.2 /100 | #266 | Tragic 6.6% |
| Trinidadians and Tobagonians | 0.2 /100 | #267 | Tragic 6.6% |
| Spanish | 0.2 /100 | #268 | Tragic 6.6% |
| French | 0.1 /100 | #269 | Tragic 6.6% |
Demographics Similar to German Russians by Ambulatory Disability
In terms of ambulatory disability, the demographic groups most similar to German Russians are Immigrants from Albania (6.3%, a difference of 0.030%), Hungarian (6.3%, a difference of 0.030%), Indonesian (6.3%, a difference of 0.070%), Guamanian/Chamorro (6.3%, a difference of 0.17%), and Canadian (6.3%, a difference of 0.21%).
| Demographics | Rating | Rank | Ambulatory Disability |
| Immigrants | Latin America | 11.0 /100 | #215 | Poor 6.3% |
| Canadians | 10.9 /100 | #216 | Poor 6.3% |
| Yugoslavians | 10.9 /100 | #217 | Poor 6.3% |
| Guamanians/Chamorros | 10.6 /100 | #218 | Poor 6.3% |
| Indonesians | 9.9 /100 | #219 | Tragic 6.3% |
| Immigrants | Albania | 9.6 /100 | #220 | Tragic 6.3% |
| Hungarians | 9.6 /100 | #221 | Tragic 6.3% |
| German Russians | 9.4 /100 | #222 | Tragic 6.3% |
| Immigrants | Honduras | 7.6 /100 | #223 | Tragic 6.3% |
| Liberians | 7.1 /100 | #224 | Tragic 6.3% |
| Hondurans | 6.3 /100 | #225 | Tragic 6.3% |
| Slavs | 5.1 /100 | #226 | Tragic 6.4% |
| Cubans | 4.0 /100 | #227 | Tragic 6.4% |
| Portuguese | 4.0 /100 | #228 | Tragic 6.4% |
| Czechoslovakians | 3.8 /100 | #229 | Tragic 6.4% |