Ecuadorian vs Mongolian Child Poverty Under the Age of 5
COMPARE
Ecuadorian
Mongolian
Child Poverty Under the Age of 5
Child Poverty Under the Age of 5 Comparison
Ecuadorians
Mongolians
19.2%
CHILD POVERTY UNDER THE AGE OF 5
1.2/ 100
METRIC RATING
230th/ 347
METRIC RANK
16.1%
CHILD POVERTY UNDER THE AGE OF 5
92.5/ 100
METRIC RATING
121st/ 347
METRIC RANK
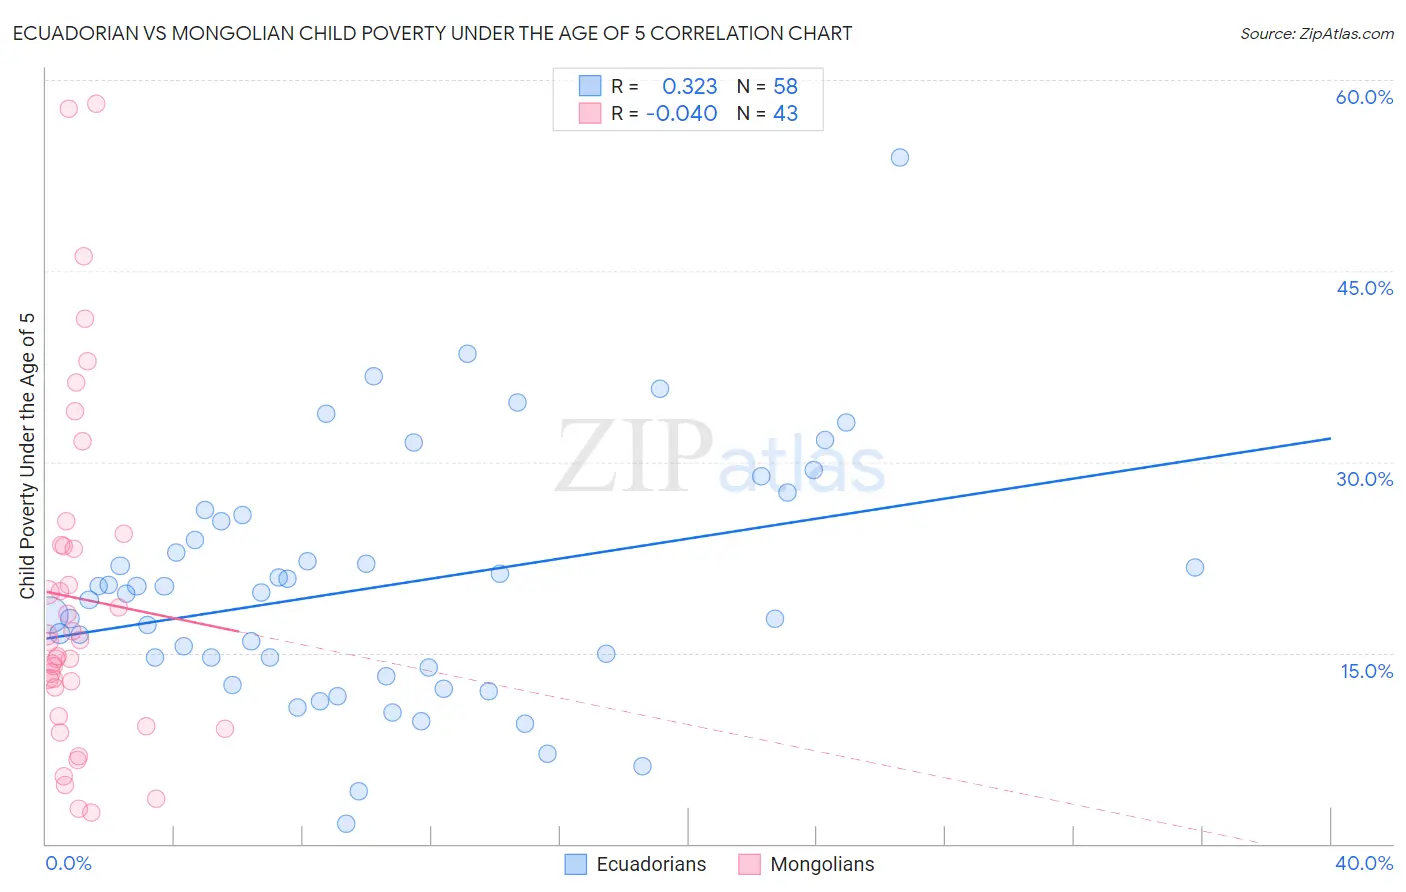
Ecuadorian vs Mongolian Child Poverty Under the Age of 5 Correlation Chart
The statistical analysis conducted on geographies consisting of 306,907,692 people shows a mild positive correlation between the proportion of Ecuadorians and poverty level among children under the age of 5 in the United States with a correlation coefficient (R) of 0.323 and weighted average of 19.2%. Similarly, the statistical analysis conducted on geographies consisting of 138,133,739 people shows no correlation between the proportion of Mongolians and poverty level among children under the age of 5 in the United States with a correlation coefficient (R) of -0.040 and weighted average of 16.1%, a difference of 19.2%.
Child Poverty Under the Age of 5 Correlation Summary
| Measurement | Ecuadorian | Mongolian |
| Minimum | 1.5% | 2.4% |
| Maximum | 53.9% | 58.2% |
| Range | 52.3% | 55.7% |
| Mean | 20.1% | 19.3% |
| Median | 19.7% | 15.9% |
| Interquartile 25% (IQ1) | 13.9% | 10.0% |
| Interquartile 75% (IQ3) | 25.4% | 23.5% |
| Interquartile Range (IQR) | 11.5% | 13.5% |
| Standard Deviation (Sample) | 9.5% | 13.5% |
| Standard Deviation (Population) | 9.5% | 13.3% |
Similar Demographics by Child Poverty Under the Age of 5
Demographics Similar to Ecuadorians by Child Poverty Under the Age of 5
In terms of child poverty under the age of 5, the demographic groups most similar to Ecuadorians are Ghanaian (19.2%, a difference of 0.040%), Bermudan (19.2%, a difference of 0.050%), Immigrants from Sudan (19.2%, a difference of 0.12%), Cape Verdean (19.1%, a difference of 0.43%), and Immigrants from Eritrea (19.1%, a difference of 0.61%).
| Demographics | Rating | Rank | Child Poverty Under the Age of 5 |
| Cubans | 1.7 /100 | #223 | Tragic 19.1% |
| Nicaraguans | 1.6 /100 | #224 | Tragic 19.1% |
| Nigerians | 1.6 /100 | #225 | Tragic 19.1% |
| Immigrants | Eritrea | 1.5 /100 | #226 | Tragic 19.1% |
| Cape Verdeans | 1.4 /100 | #227 | Tragic 19.1% |
| Immigrants | Sudan | 1.3 /100 | #228 | Tragic 19.2% |
| Ghanaians | 1.2 /100 | #229 | Tragic 19.2% |
| Ecuadorians | 1.2 /100 | #230 | Tragic 19.2% |
| Bermudans | 1.2 /100 | #231 | Tragic 19.2% |
| Trinidadians and Tobagonians | 0.9 /100 | #232 | Tragic 19.3% |
| Sudanese | 0.9 /100 | #233 | Tragic 19.3% |
| Immigrants | Micronesia | 0.9 /100 | #234 | Tragic 19.4% |
| Immigrants | Laos | 0.8 /100 | #235 | Tragic 19.4% |
| Immigrants | Trinidad and Tobago | 0.8 /100 | #236 | Tragic 19.4% |
| Immigrants | Cabo Verde | 0.6 /100 | #237 | Tragic 19.5% |
Demographics Similar to Mongolians by Child Poverty Under the Age of 5
In terms of child poverty under the age of 5, the demographic groups most similar to Mongolians are Immigrants from Peru (16.1%, a difference of 0.010%), Immigrants from Southern Europe (16.1%, a difference of 0.20%), Austrian (16.1%, a difference of 0.22%), Swiss (16.1%, a difference of 0.23%), and Immigrants from Jordan (16.1%, a difference of 0.27%).
| Demographics | Rating | Rank | Child Poverty Under the Age of 5 |
| Immigrants | Kuwait | 93.9 /100 | #114 | Exceptional 16.0% |
| Albanians | 93.8 /100 | #115 | Exceptional 16.0% |
| Immigrants | Austria | 93.5 /100 | #116 | Exceptional 16.0% |
| Basques | 93.4 /100 | #117 | Exceptional 16.0% |
| Immigrants | Denmark | 93.4 /100 | #118 | Exceptional 16.0% |
| Immigrants | Jordan | 93.2 /100 | #119 | Exceptional 16.1% |
| Immigrants | Peru | 92.6 /100 | #120 | Exceptional 16.1% |
| Mongolians | 92.5 /100 | #121 | Exceptional 16.1% |
| Immigrants | Southern Europe | 92.0 /100 | #122 | Exceptional 16.1% |
| Austrians | 92.0 /100 | #123 | Exceptional 16.1% |
| Swiss | 92.0 /100 | #124 | Exceptional 16.1% |
| Native Hawaiians | 91.8 /100 | #125 | Exceptional 16.2% |
| Immigrants | Albania | 91.8 /100 | #126 | Exceptional 16.2% |
| Immigrants | England | 91.5 /100 | #127 | Exceptional 16.2% |
| South Africans | 90.1 /100 | #128 | Exceptional 16.2% |