Ecuadorian vs Alaska Native Child Poverty Under the Age of 5
COMPARE
Ecuadorian
Alaska Native
Child Poverty Under the Age of 5
Child Poverty Under the Age of 5 Comparison
Ecuadorians
Alaska Natives
19.2%
CHILD POVERTY UNDER THE AGE OF 5
1.2/ 100
METRIC RATING
230th/ 347
METRIC RANK
19.6%
CHILD POVERTY UNDER THE AGE OF 5
0.5/ 100
METRIC RATING
241st/ 347
METRIC RANK
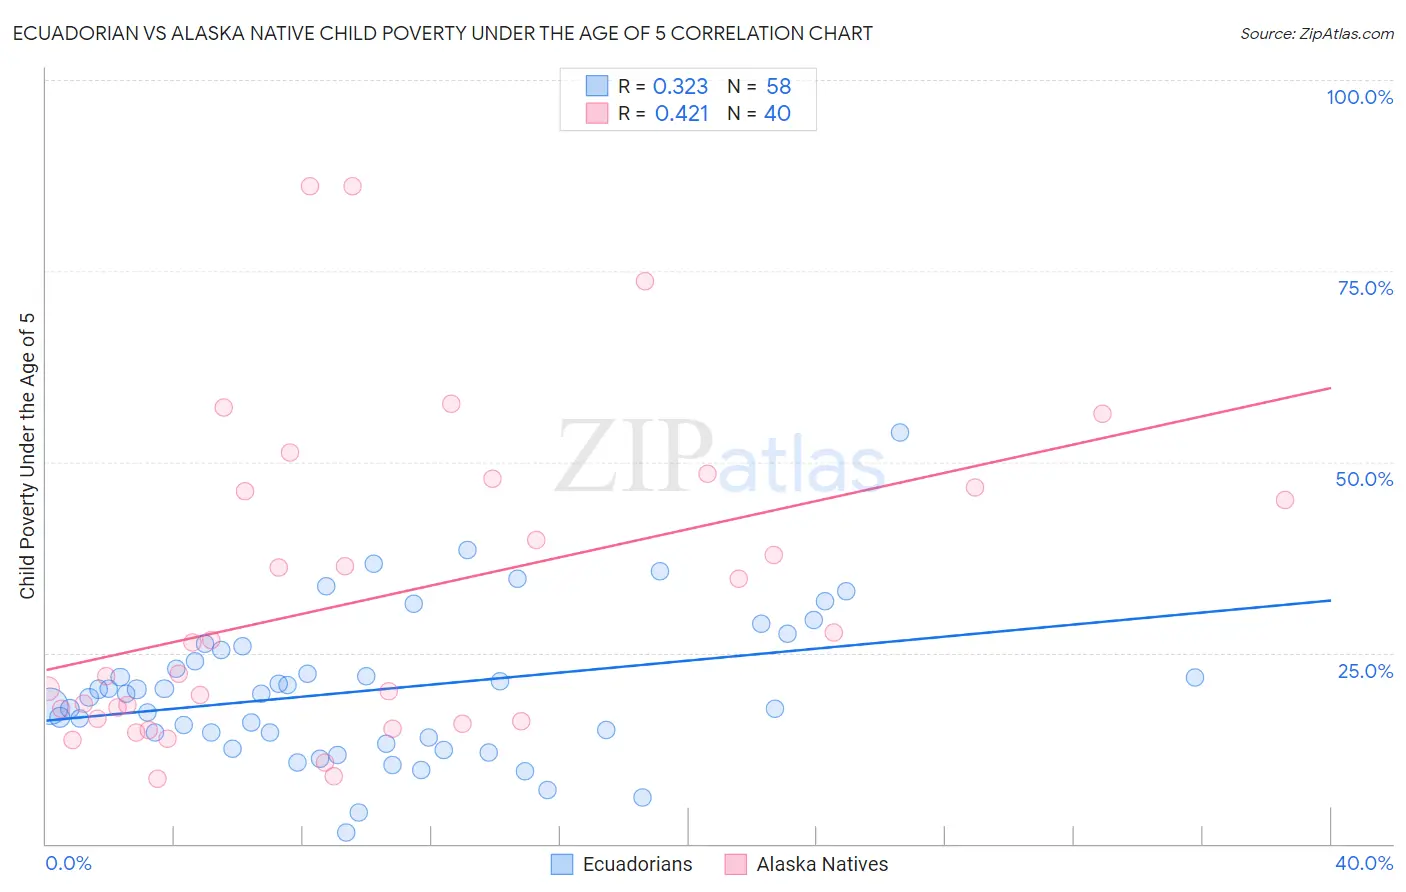
Ecuadorian vs Alaska Native Child Poverty Under the Age of 5 Correlation Chart
The statistical analysis conducted on geographies consisting of 306,907,692 people shows a mild positive correlation between the proportion of Ecuadorians and poverty level among children under the age of 5 in the United States with a correlation coefficient (R) of 0.323 and weighted average of 19.2%. Similarly, the statistical analysis conducted on geographies consisting of 76,221,903 people shows a moderate positive correlation between the proportion of Alaska Natives and poverty level among children under the age of 5 in the United States with a correlation coefficient (R) of 0.421 and weighted average of 19.6%, a difference of 2.1%.
Child Poverty Under the Age of 5 Correlation Summary
| Measurement | Ecuadorian | Alaska Native |
| Minimum | 1.5% | 8.4% |
| Maximum | 53.9% | 86.0% |
| Range | 52.3% | 77.6% |
| Mean | 20.1% | 32.3% |
| Median | 19.7% | 24.3% |
| Interquartile 25% (IQ1) | 13.9% | 16.2% |
| Interquartile 75% (IQ3) | 25.4% | 46.4% |
| Interquartile Range (IQR) | 11.5% | 30.2% |
| Standard Deviation (Sample) | 9.5% | 20.5% |
| Standard Deviation (Population) | 9.5% | 20.3% |
Demographics Similar to Ecuadorians and Alaska Natives by Child Poverty Under the Age of 5
In terms of child poverty under the age of 5, the demographic groups most similar to Ecuadorians are Ghanaian (19.2%, a difference of 0.040%), Bermudan (19.2%, a difference of 0.050%), Immigrants from Sudan (19.2%, a difference of 0.12%), Cape Verdean (19.1%, a difference of 0.43%), and Immigrants from Eritrea (19.1%, a difference of 0.61%). Similarly, the demographic groups most similar to Alaska Natives are Immigrants from Ecuador (19.6%, a difference of 0.060%), Immigrants from Guyana (19.6%, a difference of 0.11%), Osage (19.6%, a difference of 0.22%), Immigrants from Ghana (19.6%, a difference of 0.24%), and Immigrants from Western Africa (19.7%, a difference of 0.42%).
| Demographics | Rating | Rank | Child Poverty Under the Age of 5 |
| Nigerians | 1.6 /100 | #225 | Tragic 19.1% |
| Immigrants | Eritrea | 1.5 /100 | #226 | Tragic 19.1% |
| Cape Verdeans | 1.4 /100 | #227 | Tragic 19.1% |
| Immigrants | Sudan | 1.3 /100 | #228 | Tragic 19.2% |
| Ghanaians | 1.2 /100 | #229 | Tragic 19.2% |
| Ecuadorians | 1.2 /100 | #230 | Tragic 19.2% |
| Bermudans | 1.2 /100 | #231 | Tragic 19.2% |
| Trinidadians and Tobagonians | 0.9 /100 | #232 | Tragic 19.3% |
| Sudanese | 0.9 /100 | #233 | Tragic 19.3% |
| Immigrants | Micronesia | 0.9 /100 | #234 | Tragic 19.4% |
| Immigrants | Laos | 0.8 /100 | #235 | Tragic 19.4% |
| Immigrants | Trinidad and Tobago | 0.8 /100 | #236 | Tragic 19.4% |
| Immigrants | Cabo Verde | 0.6 /100 | #237 | Tragic 19.5% |
| Salvadorans | 0.6 /100 | #238 | Tragic 19.5% |
| Vietnamese | 0.6 /100 | #239 | Tragic 19.5% |
| Immigrants | Ecuador | 0.5 /100 | #240 | Tragic 19.6% |
| Alaska Natives | 0.5 /100 | #241 | Tragic 19.6% |
| Immigrants | Guyana | 0.5 /100 | #242 | Tragic 19.6% |
| Osage | 0.5 /100 | #243 | Tragic 19.6% |
| Immigrants | Ghana | 0.5 /100 | #244 | Tragic 19.6% |
| Immigrants | Western Africa | 0.4 /100 | #245 | Tragic 19.7% |