Ecuadorian vs Immigrants from Liberia In Labor Force | Age 45-54

COMPARE

Ecuadorian
Race
Ancestry
AfghanAfricanAlaska NativeAlaskan AthabascanAlbanianAleutAlsatianAmericanApacheArabArapahoArgentineanArmenianAssyrian/Chaldean/SyriacAustralianAustrianBahamianBangladeshiBarbadianBasqueBelgianBelizeanBermudanBhutaneseBlackfeetBolivianBrazilianBritishBritish West IndianBulgarianBurmeseCajunCambodianCanadianCape VerdeanCarpatho RusynCelticCentral AmericanCentral American IndianCherokeeCheyenneChickasawChileanChineseChippewaChoctawColombianColvilleComancheCosta RicanCreeCreekCroatianCrowCubanCypriotCzechCzechoslovakianDanishDelawareDominicanDutchDutch West IndianEastern EuropeanEcuadorianEgyptianEnglishEstonianEthiopianEuropeanFijianFilipinoFinnishFrenchFrench American IndianFrench CanadianGermanGerman RussianGhanaianGreekGuamanian/ChamorroGuatemalanGuyaneseHaitianHmongHonduranHopiHoumaHungarianIcelanderIndian (Asian)IndonesianInupiatIranianIraqiIrishIroquoisIsraeliItalianJamaicanJapaneseJordanianKenyanKiowaKoreanLaotianLatvianLebaneseLiberianLithuanianLumbeeLuxembourgerMacedonianMalaysianMalteseMarshalleseMenomineeMexicanMexican American IndianMongolianMoroccanNative HawaiianNavajoNepaleseNew ZealanderNicaraguanNigerianNorthern EuropeanNorwegianOkinawanOsageOttawaPaiutePakistaniPalestinianPanamanianParaguayanPennsylvania GermanPeruvianPimaPolishPortuguesePotawatomiPuebloPuerto RicanPuget Sound SalishRomanianRussianSalvadoranSamoanScandinavianScotch-IrishScottishSeminoleSenegaleseSerbianShoshoneSierra LeoneanSiouxSlavicSlovakSloveneSomaliSouth AfricanSouth AmericanSouth American IndianSoviet UnionSpaniardSpanishSpanish AmericanSpanish American IndianSri LankanSubsaharan AfricanSudaneseSwedishSwissSyrianTaiwaneseThaiTlingit-HaidaTohono O'OdhamTonganTrinidadian and TobagonianTsimshianTurkishU.S. Virgin IslanderUgandanUkrainianUruguayanUteVenezuelanVietnameseWelshWest IndianYakamaYaquiYugoslavianYumanYup'ikZimbabwean
Immigration
NonimmigrantsImmigrantsAfghanistanAfricaAlbaniaArgentinaArmeniaAsiaAustraliaAustriaBahamasBangladeshBarbadosBelarusBelgiumBelizeBoliviaBosnia and HerzegovinaBrazilBulgariaBurma/MyanmarCabo VerdeCambodiaCameroonCanadaCaribbeanCentral AmericaChileChinaColombiaCongoCosta RicaCroatiaCubaCzechoslovakiaDenmarkDominicaDominican RepublicEastern AfricaEastern AsiaEastern EuropeEcuadorEgyptEl SalvadorEnglandEritreaEthiopiaEuropeFijiFranceGermanyGhanaGreeceGrenadaGuatemalaGuyanaHaitiHondurasHong KongHungaryIndiaIndonesiaIranIraqIrelandIsraelItalyJamaicaJapanJordanKazakhstanKenyaKoreaKuwaitLaosLatin AmericaLatviaLebanonLithuaniaMalaysiaMexicoMicronesiaMiddle AfricaMoldovaMoroccoNepalNetherlandsNicaraguaNigeriaNorth AmericaNorth MacedoniaNorthern AfricaNorthern EuropeNorwayOceaniaPakistanPanamaPeruPhilippinesPolandPortugalRomaniaRussiaSaudi ArabiaScotlandSenegalSerbiaSierra LeoneSingaporeSomaliaSouth AfricaSouth AmericaSouth Central AsiaSouth Eastern AsiaSouthern EuropeSpainSri LankaSt. Vincent and the GrenadinesSudanSwedenSwitzerlandSyriaTaiwanThailandTrinidad and TobagoTurkeyUgandaUkraineUruguayUzbekistanVenezuelaVietnamWest IndiesWestern AfricaWestern AsiaWestern EuropeYemenZaireZimbabweAzores
Immigrants from Liberia
Race
Ancestry
AfghanAfricanAlaska NativeAlaskan AthabascanAlbanianAleutAlsatianAmericanApacheArabArapahoArgentineanArmenianAssyrian/Chaldean/SyriacAustralianAustrianBahamianBangladeshiBarbadianBasqueBelgianBelizeanBermudanBhutaneseBlackfeetBolivianBrazilianBritishBritish West IndianBulgarianBurmeseCajunCambodianCanadianCape VerdeanCarpatho RusynCelticCentral AmericanCentral American IndianCherokeeCheyenneChickasawChileanChineseChippewaChoctawColombianColvilleComancheCosta RicanCreeCreekCroatianCrowCubanCypriotCzechCzechoslovakianDanishDelawareDominicanDutchDutch West IndianEastern EuropeanEgyptianEnglishEstonianEthiopianEuropeanFijianFilipinoFinnishFrenchFrench American IndianFrench CanadianGermanGerman RussianGhanaianGreekGuamanian/ChamorroGuatemalanGuyaneseHaitianHmongHonduranHopiHoumaHungarianIcelanderIndian (Asian)IndonesianInupiatIranianIraqiIrishIroquoisIsraeliItalianJamaicanJapaneseJordanianKenyanKiowaKoreanLaotianLatvianLebaneseLiberianLithuanianLumbeeLuxembourgerMacedonianMalaysianMalteseMarshalleseMenomineeMexicanMexican American IndianMongolianMoroccanNative HawaiianNavajoNepaleseNew ZealanderNicaraguanNigerianNorthern EuropeanNorwegianOkinawanOsageOttawaPaiutePakistaniPalestinianPanamanianParaguayanPennsylvania GermanPeruvianPimaPolishPortuguesePotawatomiPuebloPuerto RicanPuget Sound SalishRomanianRussianSalvadoranSamoanScandinavianScotch-IrishScottishSeminoleSenegaleseSerbianShoshoneSierra LeoneanSiouxSlavicSlovakSloveneSomaliSouth AfricanSouth AmericanSouth American IndianSoviet UnionSpaniardSpanishSpanish AmericanSpanish American IndianSri LankanSubsaharan AfricanSudaneseSwedishSwissSyrianTaiwaneseThaiTlingit-HaidaTohono O'OdhamTonganTrinidadian and TobagonianTsimshianTurkishU.S. Virgin IslanderUgandanUkrainianUruguayanUteVenezuelanVietnameseWelshWest IndianYakamaYaquiYugoslavianYumanYup'ikZimbabwean
Immigration
NonimmigrantsImmigrantsAfghanistanAfricaAlbaniaArgentinaArmeniaAsiaAustraliaAustriaBahamasBangladeshBarbadosBelarusBelgiumBelizeBoliviaBosnia and HerzegovinaBrazilBulgariaBurma/MyanmarCabo VerdeCambodiaCameroonCanadaCaribbeanCentral AmericaChileChinaColombiaCongoCosta RicaCroatiaCubaCzechoslovakiaDenmarkDominicaDominican RepublicEastern AfricaEastern AsiaEastern EuropeEcuadorEgyptEl SalvadorEnglandEritreaEthiopiaEuropeFijiFranceGermanyGhanaGreeceGrenadaGuatemalaGuyanaHaitiHondurasHong KongHungaryIndiaIndonesiaIranIraqIrelandIsraelItalyJamaicaJapanJordanKazakhstanKenyaKoreaKuwaitLaosLatin AmericaLatviaLebanonLiberiaLithuaniaMalaysiaMexicoMicronesiaMiddle AfricaMoldovaMoroccoNepalNetherlandsNicaraguaNigeriaNorth AmericaNorth MacedoniaNorthern AfricaNorthern EuropeNorwayOceaniaPakistanPanamaPeruPhilippinesPolandPortugalRomaniaRussiaSaudi ArabiaScotlandSenegalSerbiaSierra LeoneSingaporeSomaliaSouth AfricaSouth AmericaSouth Central AsiaSouth Eastern AsiaSouthern EuropeSpainSri LankaSt. Vincent and the GrenadinesSudanSwedenSwitzerlandSyriaTaiwanThailandTrinidad and TobagoTurkeyUgandaUkraineUruguayUzbekistanVenezuelaVietnamWest IndiesWestern AfricaWestern AsiaWestern EuropeYemenZaireZimbabweAzores
In Labor Force | Age 45-54
Income
Poverty
Unemployment
Labor Participation
Family Structure
Vehicle Availability
Education Level
Disability

In Labor Force | Age 45-54 Comparison

Ecuadorians

Immigrants from Liberia

Tragic
Average
82.3%
IN LABOR FORCE | AGE 45-54
6.3/ 100
METRIC RATING
212th/ 347
METRIC RANK
82.7%
IN LABOR FORCE | AGE 45-54
47.9/ 100
METRIC RATING
175th/ 347
METRIC RANK

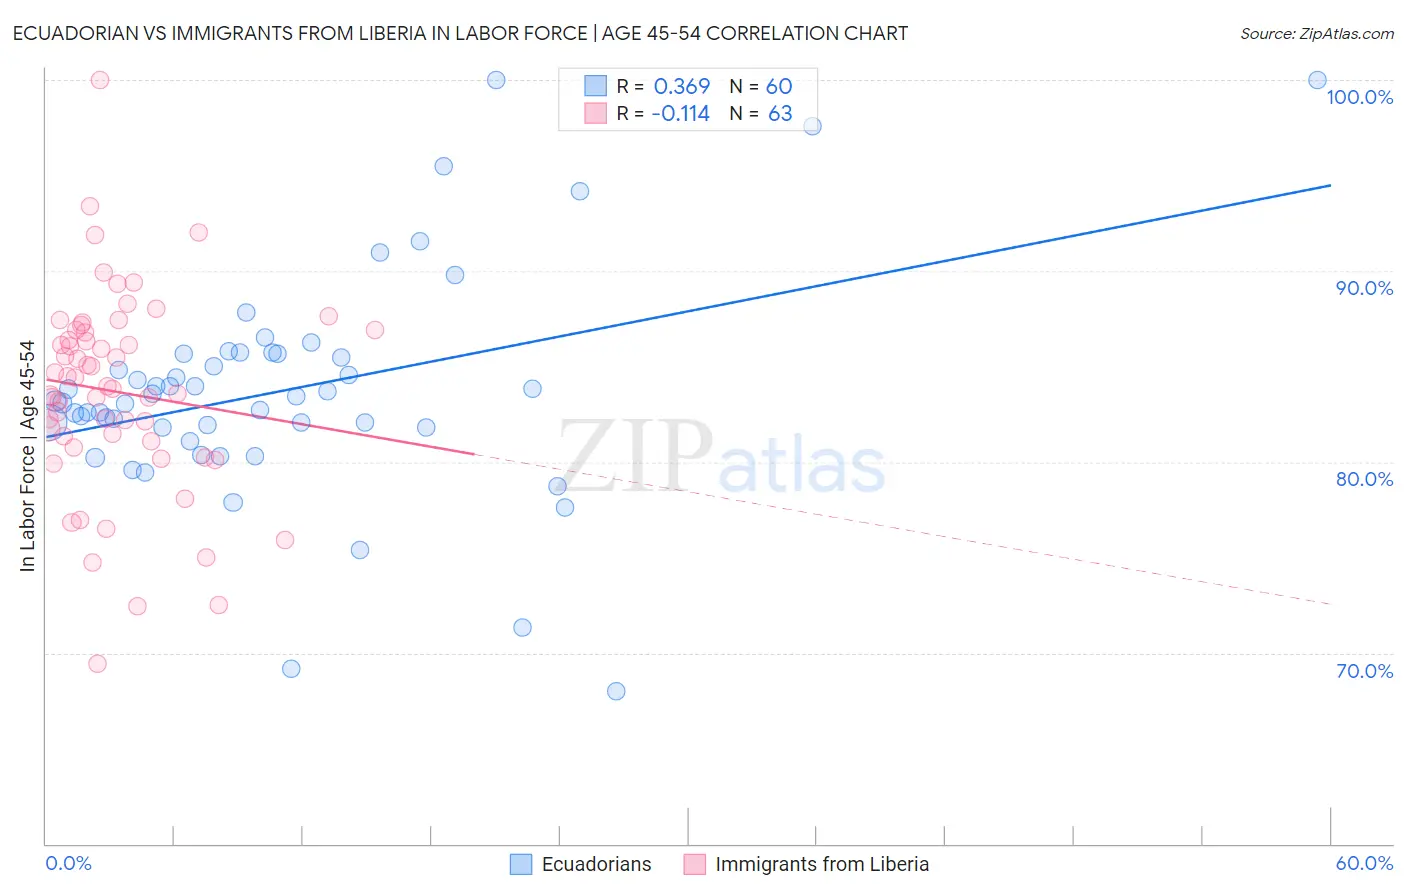
Ecuadorian vs Immigrants from Liberia In Labor Force | Age 45-54 Correlation Chart

The statistical analysis conducted on geographies consisting of 317,622,832 people shows a mild positive correlation between the proportion of Ecuadorians and labor force participation rate among population between the ages 45 and 54 in the United States with a correlation coefficient (R) of 0.369 and weighted average of 82.3%. Similarly, the statistical analysis conducted on geographies consisting of 135,233,858 people shows a poor negative correlation between the proportion of Immigrants from Liberia and labor force participation rate among population between the ages 45 and 54 in the United States with a correlation coefficient (R) of -0.114 and weighted average of 82.7%, a difference of 0.58%.
Ecuadorian vs Immigrants from Liberia In Labor Force | Age 45-54

In Labor Force | Age 45-54 Correlation Summary

MeasurementEcuadorianImmigrants from Liberia
Minimum68.0%69.4%
Maximum100.0%100.0%
Range32.0%30.6%
Mean83.8%83.7%
Median83.3%84.0%
Interquartile 25% (IQ1)81.8%81.1%
Interquartile 75% (IQ3)85.7%86.9%
Interquartile Range (IQR)3.9%5.8%
Standard Deviation (Sample)5.9%5.3%
Standard Deviation (Population)5.9%5.2%

Similar Demographics by In Labor Force | Age 45-54

Demographics Similar to Ecuadorians by In Labor Force | Age 45-54

In terms of in labor force | age 45-54, the demographic groups most similar to Ecuadorians are Immigrants from Syria (82.3%, a difference of 0.010%), Immigrants from Uzbekistan (82.3%, a difference of 0.020%), Immigrants from Bahamas (82.3%, a difference of 0.030%), Immigrants from Panama (82.2%, a difference of 0.030%), and Iraqi (82.2%, a difference of 0.030%).
DemographicsRating | RankIn Labor Force | Age 45-54
Senegalese
9.5
/100
|
#205
Tragic
82.4%
Welsh
9.2
/100
|
#206
Tragic
82.3%
Immigrants | Cabo Verde
8.6
/100
|
#207
Tragic
82.3%
Native Hawaiians
8.5
/100
|
#208
Tragic
82.3%
Immigrants | Lebanon
7.4
/100
|
#209
Tragic
82.3%
Immigrants | Bahamas
7.1
/100
|
#210
Tragic
82.3%
Immigrants | Syria
6.6
/100
|
#211
Tragic
82.3%
Ecuadorians
6.3
/100
|
#212
Tragic
82.3%
Immigrants | Uzbekistan
5.8
/100
|
#213
Tragic
82.3%
Immigrants | Panama
5.6
/100
|
#214
Tragic
82.2%
Iraqis
5.6
/100
|
#215
Tragic
82.2%
Scottish
5.3
/100
|
#216
Tragic
82.2%
Portuguese
4.7
/100
|
#217
Tragic
82.2%
English
4.4
/100
|
#218
Tragic
82.2%
French
4.1
/100
|
#219
Tragic
82.2%

Demographics Similar to Immigrants from Liberia by In Labor Force | Age 45-54

In terms of in labor force | age 45-54, the demographic groups most similar to Immigrants from Liberia are Northern European (82.7%, a difference of 0.010%), Nicaraguan (82.8%, a difference of 0.020%), Costa Rican (82.8%, a difference of 0.020%), Icelander (82.8%, a difference of 0.030%), and Immigrants from Nicaragua (82.7%, a difference of 0.030%).
DemographicsRating | RankIn Labor Force | Age 45-54
Immigrants | South Africa
55.8
/100
|
#168
Average
82.8%
Immigrants | Western Africa
54.1
/100
|
#169
Average
82.8%
Pakistanis
53.2
/100
|
#170
Average
82.8%
Immigrants | Zaire
52.9
/100
|
#171
Average
82.8%
Icelanders
51.8
/100
|
#172
Average
82.8%
Nicaraguans
50.3
/100
|
#173
Average
82.8%
Costa Ricans
50.0
/100
|
#174
Average
82.8%
Immigrants | Liberia
47.9
/100
|
#175
Average
82.7%
Northern Europeans
46.9
/100
|
#176
Average
82.7%
Immigrants | Nicaragua
44.6
/100
|
#177
Average
82.7%
Nigerians
40.5
/100
|
#178
Average
82.7%
Immigrants | Switzerland
39.4
/100
|
#179
Fair
82.7%
Hungarians
38.0
/100
|
#180
Fair
82.7%
Israelis
37.7
/100
|
#181
Fair
82.7%
Immigrants | Hungary
37.1
/100
|
#182
Fair
82.7%