Ecuadorian vs Bahamian Single Mother Poverty
COMPARE
Ecuadorian
Bahamian
Single Mother Poverty
Single Mother Poverty Comparison
Ecuadorians
Bahamians
30.8%
SINGLE MOTHER POVERTY
0.9/ 100
METRIC RATING
246th/ 347
METRIC RANK
31.3%
SINGLE MOTHER POVERTY
0.2/ 100
METRIC RATING
263rd/ 347
METRIC RANK
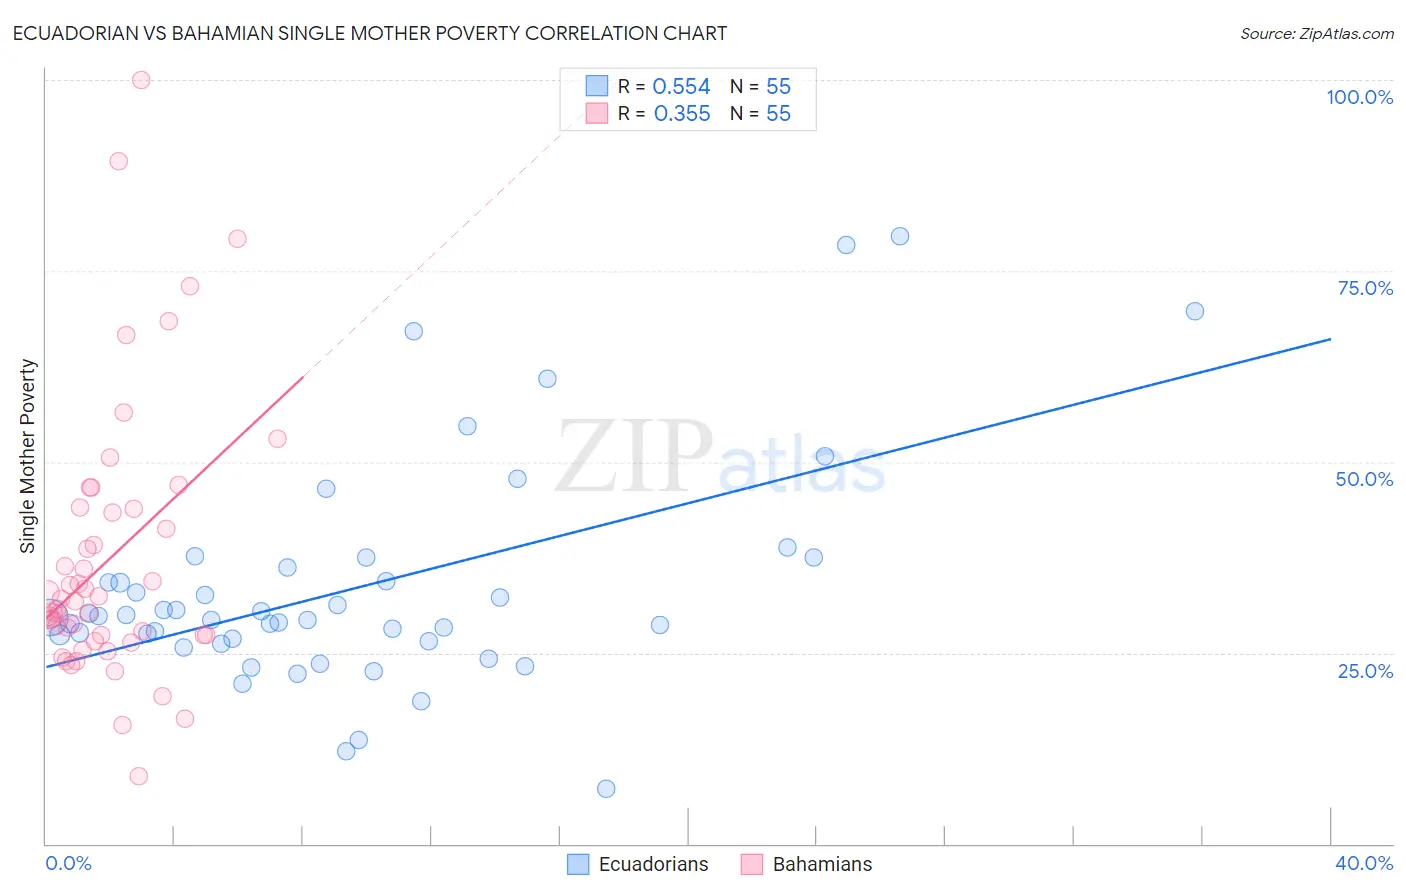
Ecuadorian vs Bahamian Single Mother Poverty Correlation Chart
The statistical analysis conducted on geographies consisting of 311,375,048 people shows a substantial positive correlation between the proportion of Ecuadorians and poverty level among single mothers in the United States with a correlation coefficient (R) of 0.554 and weighted average of 30.8%. Similarly, the statistical analysis conducted on geographies consisting of 111,917,483 people shows a mild positive correlation between the proportion of Bahamians and poverty level among single mothers in the United States with a correlation coefficient (R) of 0.355 and weighted average of 31.3%, a difference of 1.7%.
Single Mother Poverty Correlation Summary
| Measurement | Ecuadorian | Bahamian |
| Minimum | 7.3% | 8.9% |
| Maximum | 79.6% | 100.0% |
| Range | 72.3% | 91.1% |
| Mean | 33.5% | 37.3% |
| Median | 29.6% | 31.8% |
| Interquartile 25% (IQ1) | 26.5% | 27.3% |
| Interquartile 75% (IQ3) | 36.2% | 43.8% |
| Interquartile Range (IQR) | 9.8% | 16.6% |
| Standard Deviation (Sample) | 14.7% | 17.9% |
| Standard Deviation (Population) | 14.6% | 17.8% |
Demographics Similar to Ecuadorians and Bahamians by Single Mother Poverty
In terms of single mother poverty, the demographic groups most similar to Ecuadorians are West Indian (30.8%, a difference of 0.040%), French Canadian (30.8%, a difference of 0.080%), Cape Verdean (30.8%, a difference of 0.15%), Vietnamese (30.9%, a difference of 0.30%), and Barbadian (30.7%, a difference of 0.40%). Similarly, the demographic groups most similar to Bahamians are Immigrants from Ecuador (31.3%, a difference of 0.020%), Hmong (31.2%, a difference of 0.27%), Immigrants from El Salvador (31.2%, a difference of 0.41%), White/Caucasian (31.2%, a difference of 0.48%), and Immigrants from Bangladesh (31.1%, a difference of 0.64%).
| Demographics | Rating | Rank | Single Mother Poverty |
| French | 1.3 /100 | #244 | Tragic 30.7% |
| Barbadians | 1.3 /100 | #245 | Tragic 30.7% |
| Ecuadorians | 0.9 /100 | #246 | Tragic 30.8% |
| West Indians | 0.9 /100 | #247 | Tragic 30.8% |
| French Canadians | 0.9 /100 | #248 | Tragic 30.8% |
| Cape Verdeans | 0.8 /100 | #249 | Tragic 30.8% |
| Vietnamese | 0.7 /100 | #250 | Tragic 30.9% |
| Tlingit-Haida | 0.6 /100 | #251 | Tragic 30.9% |
| Alaska Natives | 0.6 /100 | #252 | Tragic 30.9% |
| Celtics | 0.6 /100 | #253 | Tragic 30.9% |
| Senegalese | 0.5 /100 | #254 | Tragic 31.0% |
| Belizeans | 0.5 /100 | #255 | Tragic 31.0% |
| Immigrants | West Indies | 0.4 /100 | #256 | Tragic 31.1% |
| Immigrants | Bahamas | 0.4 /100 | #257 | Tragic 31.1% |
| Immigrants | Caribbean | 0.4 /100 | #258 | Tragic 31.1% |
| Immigrants | Bangladesh | 0.4 /100 | #259 | Tragic 31.1% |
| Whites/Caucasians | 0.3 /100 | #260 | Tragic 31.2% |
| Immigrants | El Salvador | 0.3 /100 | #261 | Tragic 31.2% |
| Hmong | 0.3 /100 | #262 | Tragic 31.2% |
| Bahamians | 0.2 /100 | #263 | Tragic 31.3% |
| Immigrants | Ecuador | 0.2 /100 | #264 | Tragic 31.3% |