Ecuadorian vs Immigrants from Laos 9th Grade
COMPARE
Ecuadorian
Immigrants from Laos
9th Grade
9th Grade Comparison
Ecuadorians
Immigrants from Laos
91.9%
9TH GRADE
0.0/ 100
METRIC RATING
319th/ 347
METRIC RANK
93.2%
9TH GRADE
0.0/ 100
METRIC RATING
292nd/ 347
METRIC RANK
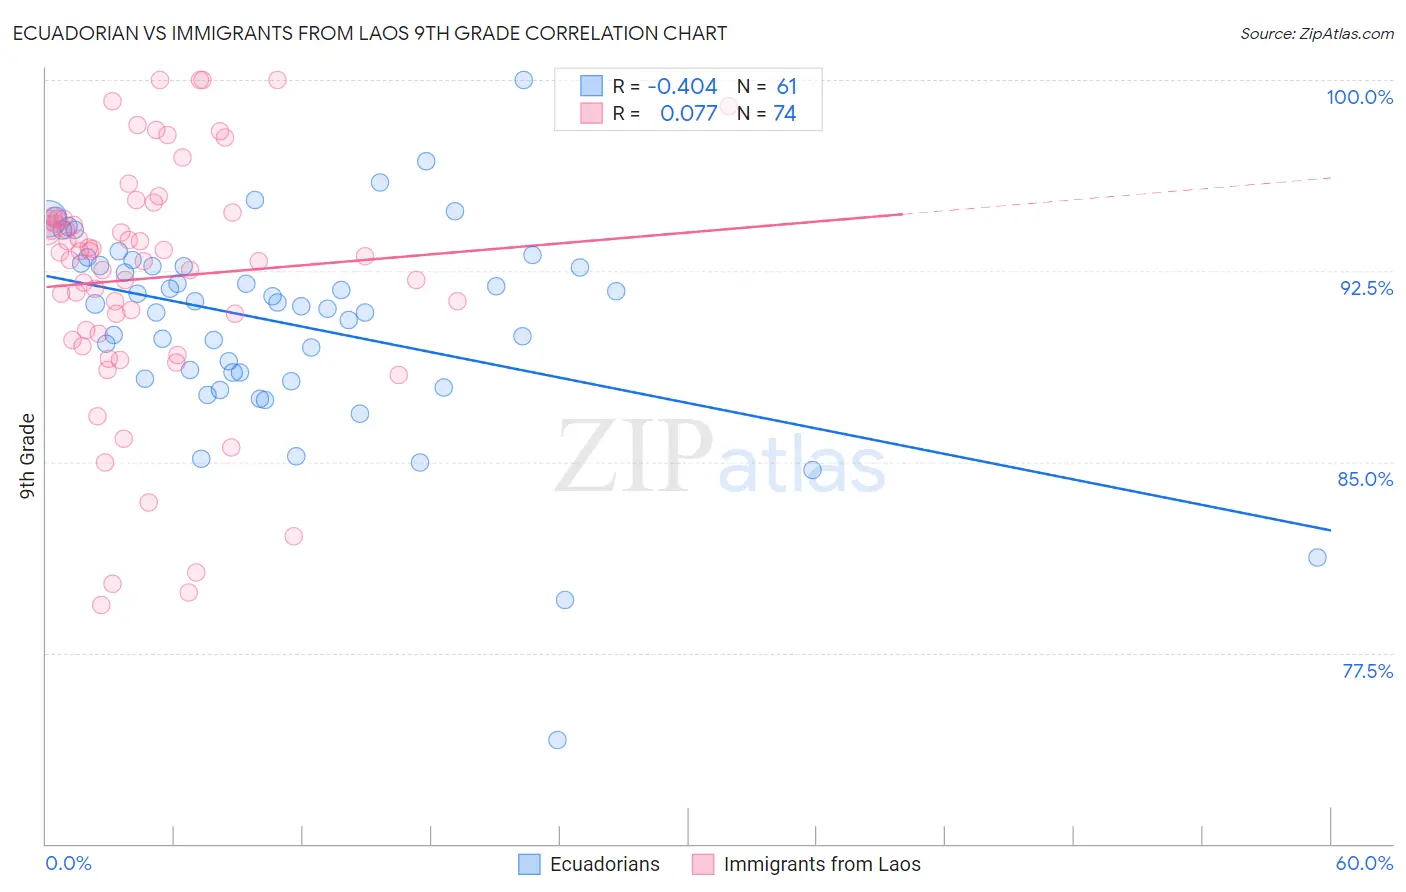
Ecuadorian vs Immigrants from Laos 9th Grade Correlation Chart
The statistical analysis conducted on geographies consisting of 317,864,750 people shows a moderate negative correlation between the proportion of Ecuadorians and percentage of population with at least 9th grade education in the United States with a correlation coefficient (R) of -0.404 and weighted average of 91.9%. Similarly, the statistical analysis conducted on geographies consisting of 201,472,886 people shows a slight positive correlation between the proportion of Immigrants from Laos and percentage of population with at least 9th grade education in the United States with a correlation coefficient (R) of 0.077 and weighted average of 93.2%, a difference of 1.3%.
9th Grade Correlation Summary
| Measurement | Ecuadorian | Immigrants from Laos |
| Minimum | 74.1% | 79.4% |
| Maximum | 100.0% | 100.0% |
| Range | 25.9% | 20.6% |
| Mean | 90.4% | 92.2% |
| Median | 91.2% | 93.1% |
| Interquartile 25% (IQ1) | 88.4% | 90.0% |
| Interquartile 75% (IQ3) | 92.8% | 94.6% |
| Interquartile Range (IQR) | 4.4% | 4.5% |
| Standard Deviation (Sample) | 4.1% | 4.8% |
| Standard Deviation (Population) | 4.1% | 4.8% |
Similar Demographics by 9th Grade
Demographics Similar to Ecuadorians by 9th Grade
In terms of 9th grade, the demographic groups most similar to Ecuadorians are Nicaraguan (91.9%, a difference of 0.040%), Nepalese (92.0%, a difference of 0.050%), Immigrants from Ecuador (91.8%, a difference of 0.11%), Belizean (91.8%, a difference of 0.13%), and Puerto Rican (91.8%, a difference of 0.14%).
| Demographics | Rating | Rank | 9th Grade |
| Houma | 0.0 /100 | #312 | Tragic 92.3% |
| Vietnamese | 0.0 /100 | #313 | Tragic 92.3% |
| Immigrants | Portugal | 0.0 /100 | #314 | Tragic 92.2% |
| Immigrants | Caribbean | 0.0 /100 | #315 | Tragic 92.2% |
| Cape Verdeans | 0.0 /100 | #316 | Tragic 92.2% |
| Immigrants | Cuba | 0.0 /100 | #317 | Tragic 92.2% |
| Nepalese | 0.0 /100 | #318 | Tragic 92.0% |
| Ecuadorians | 0.0 /100 | #319 | Tragic 91.9% |
| Nicaraguans | 0.0 /100 | #320 | Tragic 91.9% |
| Immigrants | Ecuador | 0.0 /100 | #321 | Tragic 91.8% |
| Belizeans | 0.0 /100 | #322 | Tragic 91.8% |
| Puerto Ricans | 0.0 /100 | #323 | Tragic 91.8% |
| Immigrants | Belize | 0.0 /100 | #324 | Tragic 91.8% |
| Central American Indians | 0.0 /100 | #325 | Tragic 91.5% |
| Immigrants | Armenia | 0.0 /100 | #326 | Tragic 91.4% |
Demographics Similar to Immigrants from Laos by 9th Grade
In terms of 9th grade, the demographic groups most similar to Immigrants from Laos are Sri Lankan (93.2%, a difference of 0.010%), British West Indian (93.2%, a difference of 0.020%), Cuban (93.2%, a difference of 0.020%), Immigrants from Burma/Myanmar (93.1%, a difference of 0.040%), and Indonesian (93.1%, a difference of 0.040%).
| Demographics | Rating | Rank | 9th Grade |
| Immigrants | Peru | 0.0 /100 | #285 | Tragic 93.4% |
| Immigrants | Barbados | 0.0 /100 | #286 | Tragic 93.4% |
| Immigrants | St. Vincent and the Grenadines | 0.0 /100 | #287 | Tragic 93.4% |
| Immigrants | South Eastern Asia | 0.0 /100 | #288 | Tragic 93.3% |
| Immigrants | West Indies | 0.0 /100 | #289 | Tragic 93.3% |
| Pennsylvania Germans | 0.0 /100 | #290 | Tragic 93.3% |
| British West Indians | 0.0 /100 | #291 | Tragic 93.2% |
| Immigrants | Laos | 0.0 /100 | #292 | Tragic 93.2% |
| Sri Lankans | 0.0 /100 | #293 | Tragic 93.2% |
| Cubans | 0.0 /100 | #294 | Tragic 93.2% |
| Immigrants | Burma/Myanmar | 0.0 /100 | #295 | Tragic 93.1% |
| Indonesians | 0.0 /100 | #296 | Tragic 93.1% |
| Fijians | 0.0 /100 | #297 | Tragic 93.1% |
| Haitians | 0.0 /100 | #298 | Tragic 93.1% |
| Immigrants | Grenada | 0.0 /100 | #299 | Tragic 93.0% |