Ecuadorian vs Immigrants from Hong Kong 6th Grade
COMPARE
Ecuadorian
Immigrants from Hong Kong
6th Grade
6th Grade Comparison
Ecuadorians
Immigrants from Hong Kong
95.5%
6TH GRADE
0.0/ 100
METRIC RATING
310th/ 347
METRIC RANK
96.3%
6TH GRADE
0.2/ 100
METRIC RATING
271st/ 347
METRIC RANK
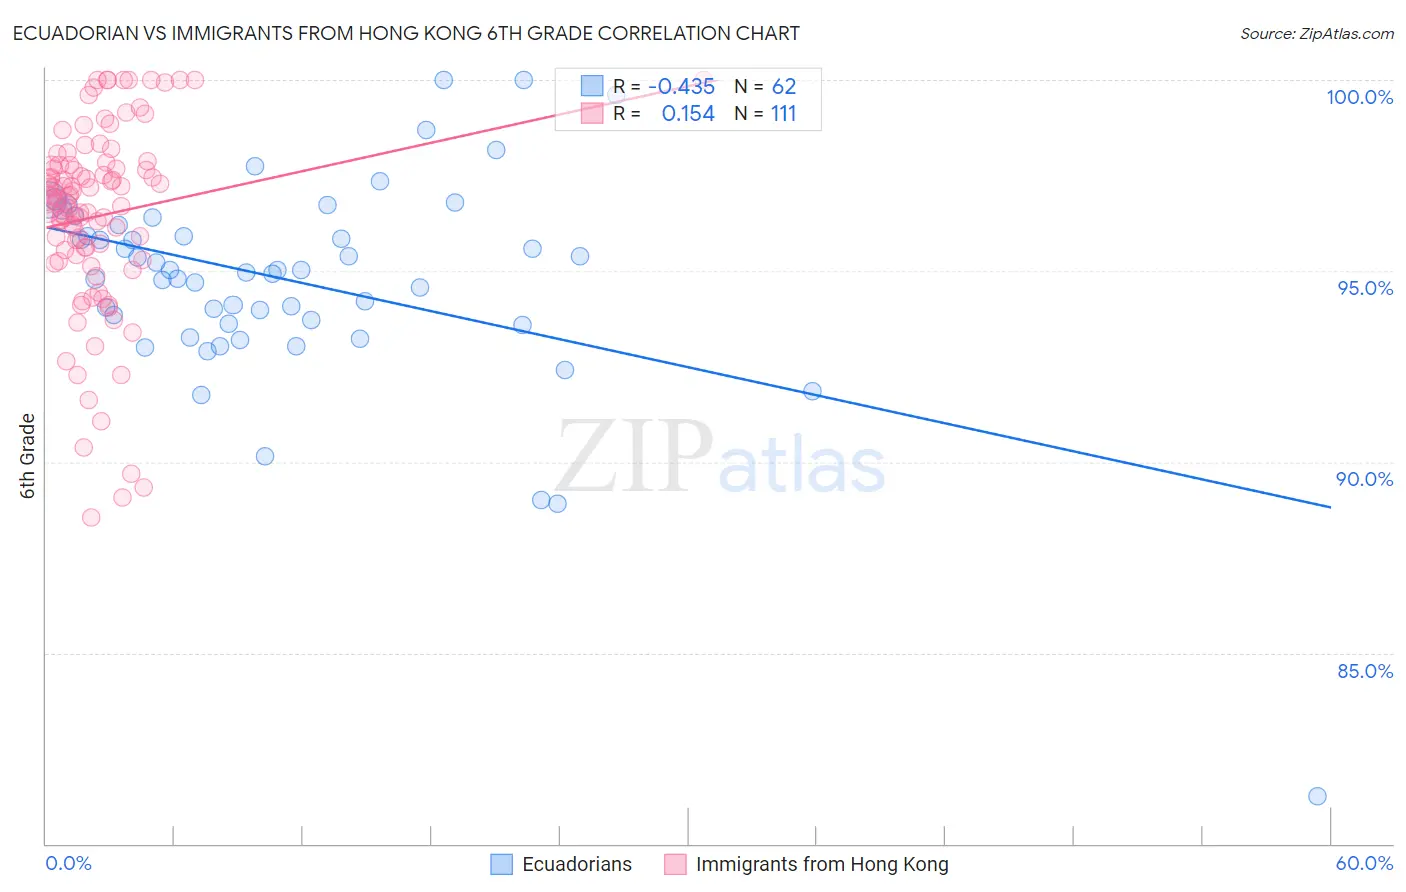
Ecuadorian vs Immigrants from Hong Kong 6th Grade Correlation Chart
The statistical analysis conducted on geographies consisting of 317,865,755 people shows a moderate negative correlation between the proportion of Ecuadorians and percentage of population with at least 6th grade education in the United States with a correlation coefficient (R) of -0.435 and weighted average of 95.5%. Similarly, the statistical analysis conducted on geographies consisting of 253,909,193 people shows a poor positive correlation between the proportion of Immigrants from Hong Kong and percentage of population with at least 6th grade education in the United States with a correlation coefficient (R) of 0.154 and weighted average of 96.3%, a difference of 0.87%.
6th Grade Correlation Summary
| Measurement | Ecuadorian | Immigrants from Hong Kong |
| Minimum | 81.2% | 88.6% |
| Maximum | 100.0% | 100.0% |
| Range | 18.7% | 11.4% |
| Mean | 94.7% | 96.4% |
| Median | 95.0% | 96.9% |
| Interquartile 25% (IQ1) | 93.6% | 95.4% |
| Interquartile 75% (IQ3) | 96.2% | 97.8% |
| Interquartile Range (IQR) | 2.6% | 2.4% |
| Standard Deviation (Sample) | 2.8% | 2.5% |
| Standard Deviation (Population) | 2.8% | 2.5% |
Similar Demographics by 6th Grade
Demographics Similar to Ecuadorians by 6th Grade
In terms of 6th grade, the demographic groups most similar to Ecuadorians are Puerto Rican (95.5%, a difference of 0.010%), Immigrants from Portugal (95.5%, a difference of 0.020%), Immigrants from Guyana (95.5%, a difference of 0.030%), Immigrants from Caribbean (95.6%, a difference of 0.060%), and Guyanese (95.6%, a difference of 0.070%).
| Demographics | Rating | Rank | 6th Grade |
| Bangladeshis | 0.0 /100 | #303 | Tragic 95.7% |
| Indonesians | 0.0 /100 | #304 | Tragic 95.6% |
| Immigrants | Cuba | 0.0 /100 | #305 | Tragic 95.6% |
| Immigrants | Haiti | 0.0 /100 | #306 | Tragic 95.6% |
| Guyanese | 0.0 /100 | #307 | Tragic 95.6% |
| Immigrants | Caribbean | 0.0 /100 | #308 | Tragic 95.6% |
| Puerto Ricans | 0.0 /100 | #309 | Tragic 95.5% |
| Ecuadorians | 0.0 /100 | #310 | Tragic 95.5% |
| Immigrants | Portugal | 0.0 /100 | #311 | Tragic 95.5% |
| Immigrants | Guyana | 0.0 /100 | #312 | Tragic 95.5% |
| Nicaraguans | 0.0 /100 | #313 | Tragic 95.4% |
| Immigrants | Vietnam | 0.0 /100 | #314 | Tragic 95.4% |
| Immigrants | Bangladesh | 0.0 /100 | #315 | Tragic 95.4% |
| Japanese | 0.0 /100 | #316 | Tragic 95.4% |
| Vietnamese | 0.0 /100 | #317 | Tragic 95.3% |
Demographics Similar to Immigrants from Hong Kong by 6th Grade
In terms of 6th grade, the demographic groups most similar to Immigrants from Hong Kong are Immigrants from Uzbekistan (96.3%, a difference of 0.010%), West Indian (96.3%, a difference of 0.010%), Immigrants from South America (96.3%, a difference of 0.010%), Immigrants from Bolivia (96.3%, a difference of 0.030%), and Ghanaian (96.4%, a difference of 0.040%).
| Demographics | Rating | Rank | 6th Grade |
| Armenians | 0.3 /100 | #264 | Tragic 96.4% |
| Immigrants | Jamaica | 0.2 /100 | #265 | Tragic 96.4% |
| Ghanaians | 0.2 /100 | #266 | Tragic 96.4% |
| Afghans | 0.2 /100 | #267 | Tragic 96.4% |
| Immigrants | Uzbekistan | 0.2 /100 | #268 | Tragic 96.3% |
| West Indians | 0.2 /100 | #269 | Tragic 96.3% |
| Immigrants | South America | 0.2 /100 | #270 | Tragic 96.3% |
| Immigrants | Hong Kong | 0.2 /100 | #271 | Tragic 96.3% |
| Immigrants | Bolivia | 0.1 /100 | #272 | Tragic 96.3% |
| Immigrants | Cameroon | 0.1 /100 | #273 | Tragic 96.3% |
| Immigrants | Philippines | 0.1 /100 | #274 | Tragic 96.3% |
| Immigrants | Ghana | 0.1 /100 | #275 | Tragic 96.3% |
| Yaqui | 0.1 /100 | #276 | Tragic 96.3% |
| Immigrants | Western Africa | 0.1 /100 | #277 | Tragic 96.3% |
| Immigrants | Thailand | 0.1 /100 | #278 | Tragic 96.3% |