Immigrants from Greece vs Alaska Native Single Female Poverty
COMPARE
Immigrants from Greece
Alaska Native
Single Female Poverty
Single Female Poverty Comparison
Immigrants from Greece
Alaska Natives
18.3%
SINGLE FEMALE POVERTY
100.0/ 100
METRIC RATING
20th/ 347
METRIC RANK
23.3%
SINGLE FEMALE POVERTY
0.1/ 100
METRIC RATING
273rd/ 347
METRIC RANK
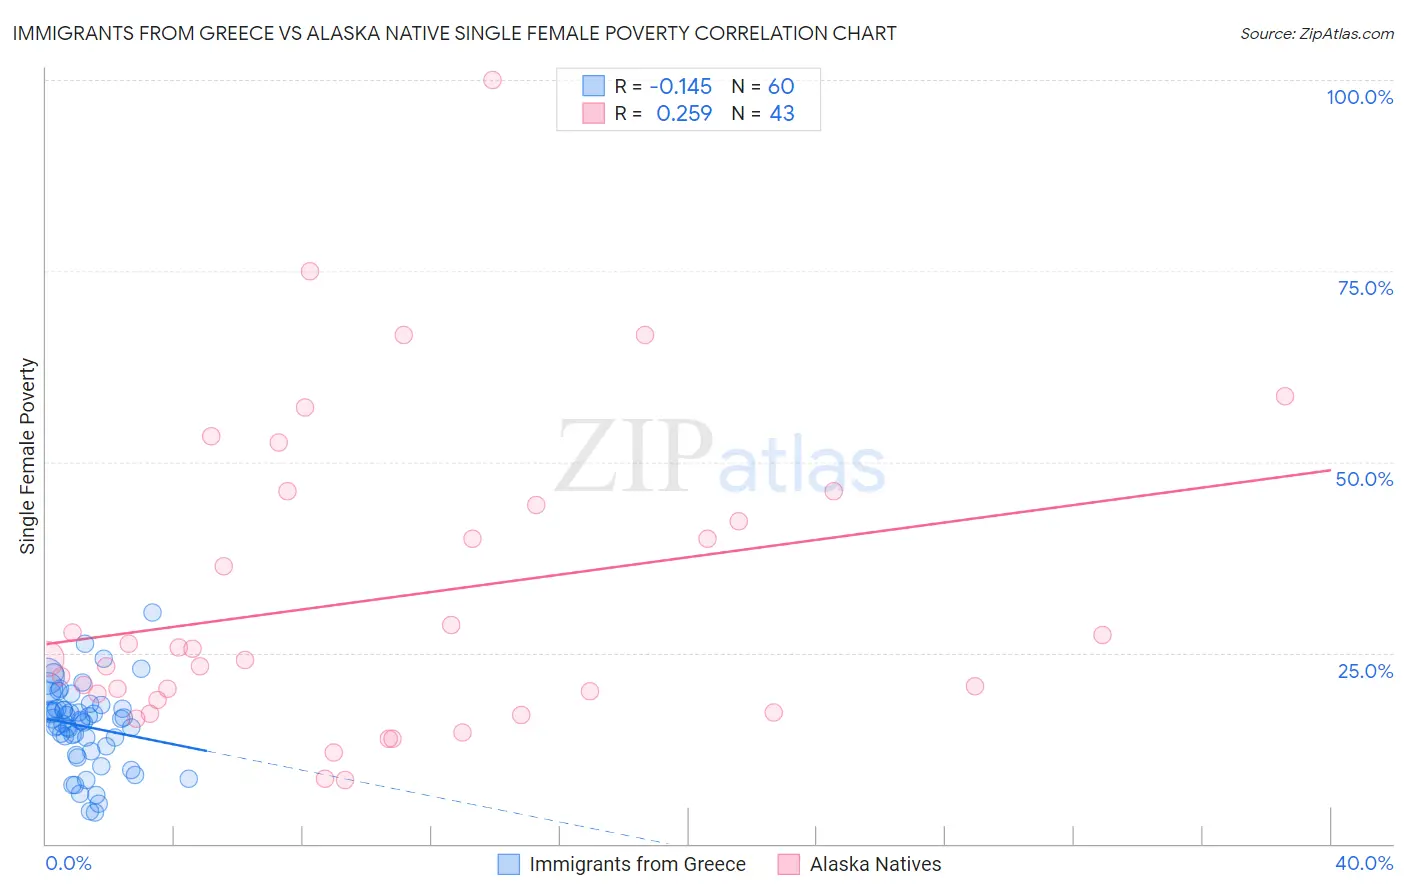
Immigrants from Greece vs Alaska Native Single Female Poverty Correlation Chart
The statistical analysis conducted on geographies consisting of 214,211,869 people shows a poor negative correlation between the proportion of Immigrants from Greece and poverty level among single females in the United States with a correlation coefficient (R) of -0.145 and weighted average of 18.3%. Similarly, the statistical analysis conducted on geographies consisting of 76,522,237 people shows a weak positive correlation between the proportion of Alaska Natives and poverty level among single females in the United States with a correlation coefficient (R) of 0.259 and weighted average of 23.3%, a difference of 27.5%.
Single Female Poverty Correlation Summary
| Measurement | Immigrants from Greece | Alaska Native |
| Minimum | 4.1% | 8.3% |
| Maximum | 30.3% | 100.0% |
| Range | 26.2% | 91.7% |
| Mean | 15.4% | 32.1% |
| Median | 16.1% | 24.2% |
| Interquartile 25% (IQ1) | 12.4% | 18.8% |
| Interquartile 75% (IQ3) | 17.7% | 44.4% |
| Interquartile Range (IQR) | 5.2% | 25.6% |
| Standard Deviation (Sample) | 5.3% | 20.0% |
| Standard Deviation (Population) | 5.3% | 19.8% |
Similar Demographics by Single Female Poverty
Demographics Similar to Immigrants from Greece by Single Female Poverty
In terms of single female poverty, the demographic groups most similar to Immigrants from Greece are Maltese (18.3%, a difference of 0.060%), Burmese (18.3%, a difference of 0.070%), Asian (18.3%, a difference of 0.070%), Armenian (18.3%, a difference of 0.30%), and Immigrants from Singapore (18.3%, a difference of 0.40%).
| Demographics | Rating | Rank | Single Female Poverty |
| Immigrants | Bolivia | 100.0 /100 | #13 | Exceptional 17.8% |
| Bolivians | 100.0 /100 | #14 | Exceptional 17.9% |
| Indians (Asian) | 100.0 /100 | #15 | Exceptional 17.9% |
| Iranians | 100.0 /100 | #16 | Exceptional 18.0% |
| Immigrants | Korea | 100.0 /100 | #17 | Exceptional 18.1% |
| Immigrants | Eastern Asia | 100.0 /100 | #18 | Exceptional 18.1% |
| Immigrants | China | 100.0 /100 | #19 | Exceptional 18.1% |
| Immigrants | Greece | 100.0 /100 | #20 | Exceptional 18.3% |
| Maltese | 100.0 /100 | #21 | Exceptional 18.3% |
| Burmese | 100.0 /100 | #22 | Exceptional 18.3% |
| Asians | 100.0 /100 | #23 | Exceptional 18.3% |
| Armenians | 100.0 /100 | #24 | Exceptional 18.3% |
| Immigrants | Singapore | 100.0 /100 | #25 | Exceptional 18.3% |
| Immigrants | Israel | 100.0 /100 | #26 | Exceptional 18.3% |
| Immigrants | Pakistan | 100.0 /100 | #27 | Exceptional 18.4% |
Demographics Similar to Alaska Natives by Single Female Poverty
In terms of single female poverty, the demographic groups most similar to Alaska Natives are Marshallese (23.3%, a difference of 0.010%), Immigrants from Senegal (23.2%, a difference of 0.25%), Mexican American Indian (23.4%, a difference of 0.27%), Subsaharan African (23.2%, a difference of 0.44%), and Inupiat (23.1%, a difference of 0.69%).
| Demographics | Rating | Rank | Single Female Poverty |
| Immigrants | Micronesia | 0.2 /100 | #266 | Tragic 23.0% |
| Senegalese | 0.2 /100 | #267 | Tragic 23.0% |
| Fijians | 0.2 /100 | #268 | Tragic 23.1% |
| Hmong | 0.2 /100 | #269 | Tragic 23.1% |
| Inupiat | 0.2 /100 | #270 | Tragic 23.1% |
| Sub-Saharan Africans | 0.1 /100 | #271 | Tragic 23.2% |
| Immigrants | Senegal | 0.1 /100 | #272 | Tragic 23.2% |
| Alaska Natives | 0.1 /100 | #273 | Tragic 23.3% |
| Marshallese | 0.1 /100 | #274 | Tragic 23.3% |
| Mexican American Indians | 0.1 /100 | #275 | Tragic 23.4% |
| Immigrants | Azores | 0.0 /100 | #276 | Tragic 23.5% |
| Pennsylvania Germans | 0.0 /100 | #277 | Tragic 23.6% |
| Immigrants | Nonimmigrants | 0.0 /100 | #278 | Tragic 23.6% |
| Alaskan Athabascans | 0.0 /100 | #279 | Tragic 23.6% |
| Immigrants | Latin America | 0.0 /100 | #280 | Tragic 23.7% |