Dutch West Indian vs Pueblo Single Male Poverty
COMPARE
Dutch West Indian
Pueblo
Single Male Poverty
Single Male Poverty Comparison
Dutch West Indians
Pueblo
16.1%
SINGLE MALE POVERTY
0.0/ 100
METRIC RATING
316th/ 347
METRIC RANK
21.6%
SINGLE MALE POVERTY
0.0/ 100
METRIC RATING
338th/ 347
METRIC RANK
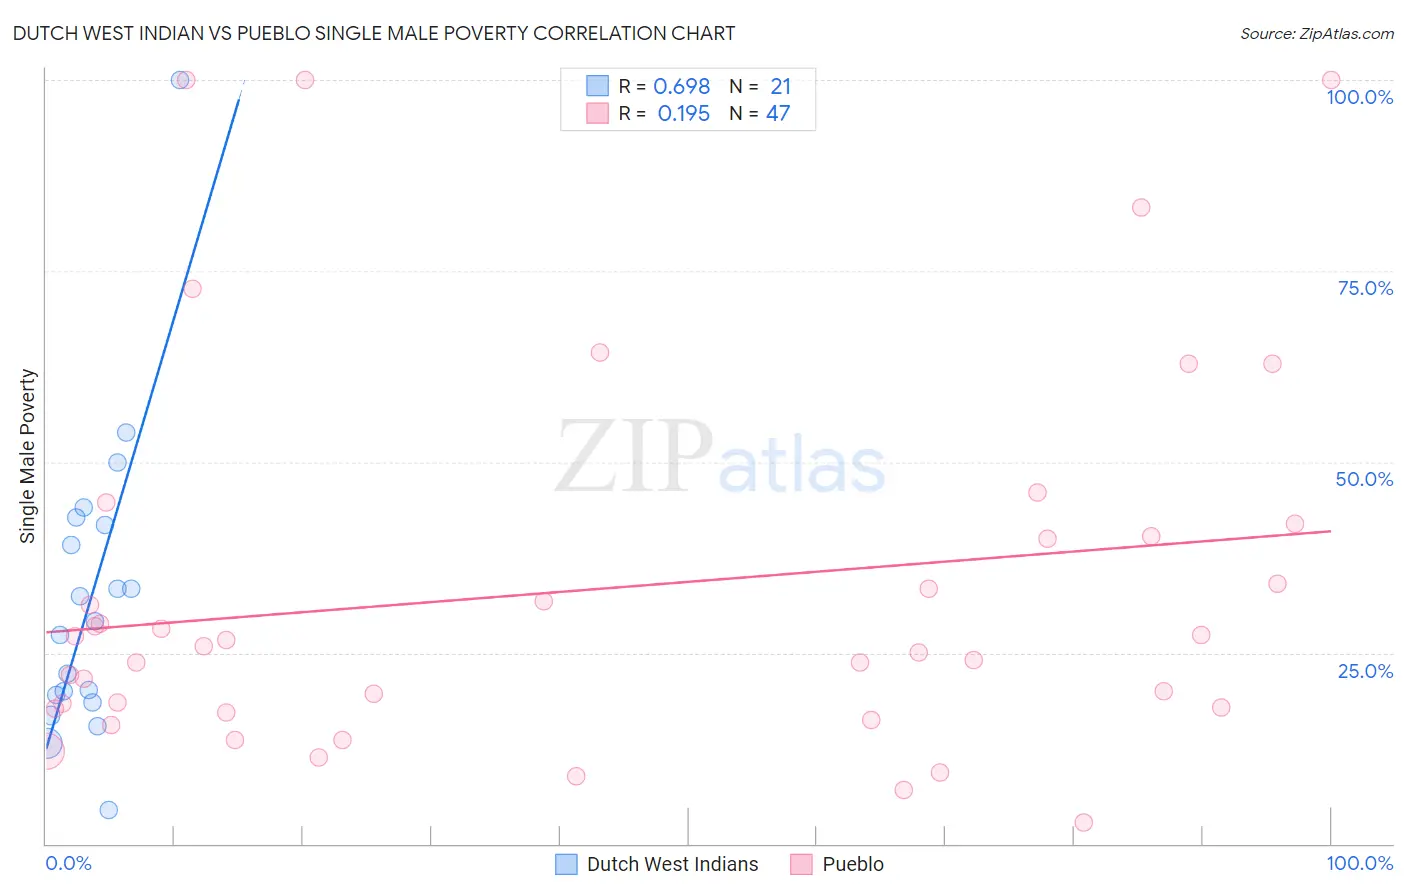
Dutch West Indian vs Pueblo Single Male Poverty Correlation Chart
The statistical analysis conducted on geographies consisting of 82,367,867 people shows a significant positive correlation between the proportion of Dutch West Indians and poverty level among single males in the United States with a correlation coefficient (R) of 0.698 and weighted average of 16.1%. Similarly, the statistical analysis conducted on geographies consisting of 115,485,335 people shows a poor positive correlation between the proportion of Pueblo and poverty level among single males in the United States with a correlation coefficient (R) of 0.195 and weighted average of 21.6%, a difference of 34.0%.
Single Male Poverty Correlation Summary
| Measurement | Dutch West Indian | Pueblo |
| Minimum | 4.5% | 2.9% |
| Maximum | 100.0% | 100.0% |
| Range | 95.5% | 97.1% |
| Mean | 32.3% | 33.2% |
| Median | 29.1% | 25.9% |
| Interquartile 25% (IQ1) | 19.0% | 17.7% |
| Interquartile 75% (IQ3) | 42.3% | 40.2% |
| Interquartile Range (IQR) | 23.3% | 22.5% |
| Standard Deviation (Sample) | 20.2% | 24.7% |
| Standard Deviation (Population) | 19.8% | 24.4% |
Similar Demographics by Single Male Poverty
Demographics Similar to Dutch West Indians by Single Male Poverty
In terms of single male poverty, the demographic groups most similar to Dutch West Indians are Cheyenne (16.1%, a difference of 0.14%), Alaskan Athabascan (16.1%, a difference of 0.19%), Black/African American (16.2%, a difference of 0.34%), Cherokee (16.1%, a difference of 0.48%), and Seminole (16.0%, a difference of 0.71%).
| Demographics | Rating | Rank | Single Male Poverty |
| Americans | 0.0 /100 | #309 | Tragic 15.8% |
| Yakama | 0.0 /100 | #310 | Tragic 15.9% |
| Seminole | 0.0 /100 | #311 | Tragic 16.0% |
| Comanche | 0.0 /100 | #312 | Tragic 16.0% |
| Cherokee | 0.0 /100 | #313 | Tragic 16.1% |
| Alaskan Athabascans | 0.0 /100 | #314 | Tragic 16.1% |
| Cheyenne | 0.0 /100 | #315 | Tragic 16.1% |
| Dutch West Indians | 0.0 /100 | #316 | Tragic 16.1% |
| Blacks/African Americans | 0.0 /100 | #317 | Tragic 16.2% |
| Chickasaw | 0.0 /100 | #318 | Tragic 16.3% |
| Chippewa | 0.0 /100 | #319 | Tragic 16.4% |
| Marshallese | 0.0 /100 | #320 | Tragic 16.4% |
| Osage | 0.0 /100 | #321 | Tragic 16.5% |
| Shoshone | 0.0 /100 | #322 | Tragic 16.7% |
| Creek | 0.0 /100 | #323 | Tragic 16.8% |
Demographics Similar to Pueblo by Single Male Poverty
In terms of single male poverty, the demographic groups most similar to Pueblo are Apache (21.6%, a difference of 0.18%), Tohono O'odham (21.6%, a difference of 0.28%), Yuman (21.3%, a difference of 1.5%), Arapaho (21.9%, a difference of 1.5%), and Sioux (22.2%, a difference of 2.8%).
| Demographics | Rating | Rank | Single Male Poverty |
| Paiute | 0.0 /100 | #331 | Tragic 19.3% |
| Natives/Alaskans | 0.0 /100 | #332 | Tragic 19.6% |
| Inupiat | 0.0 /100 | #333 | Tragic 20.0% |
| Pima | 0.0 /100 | #334 | Tragic 20.2% |
| Yuman | 0.0 /100 | #335 | Tragic 21.3% |
| Tohono O'odham | 0.0 /100 | #336 | Tragic 21.6% |
| Apache | 0.0 /100 | #337 | Tragic 21.6% |
| Pueblo | 0.0 /100 | #338 | Tragic 21.6% |
| Arapaho | 0.0 /100 | #339 | Tragic 21.9% |
| Sioux | 0.0 /100 | #340 | Tragic 22.2% |
| Crow | 0.0 /100 | #341 | Tragic 23.3% |
| Houma | 0.0 /100 | #342 | Tragic 23.5% |
| Puerto Ricans | 0.0 /100 | #343 | Tragic 25.1% |
| Lumbee | 0.0 /100 | #344 | Tragic 25.2% |
| Navajo | 0.0 /100 | #345 | Tragic 25.3% |