Dutch West Indian vs Pueblo Householder Income Ages 25 - 44 years
COMPARE
Dutch West Indian
Pueblo
Householder Income Ages 25 - 44 years
Householder Income Ages 25 - 44 years Comparison
Dutch West Indians
Pueblo
$77,260
HOUSEHOLDER INCOME AGES 25 - 44 YEARS
0.0/ 100
METRIC RATING
324th/ 347
METRIC RANK
$68,910
HOUSEHOLDER INCOME AGES 25 - 44 YEARS
0.0/ 100
METRIC RATING
344th/ 347
METRIC RANK
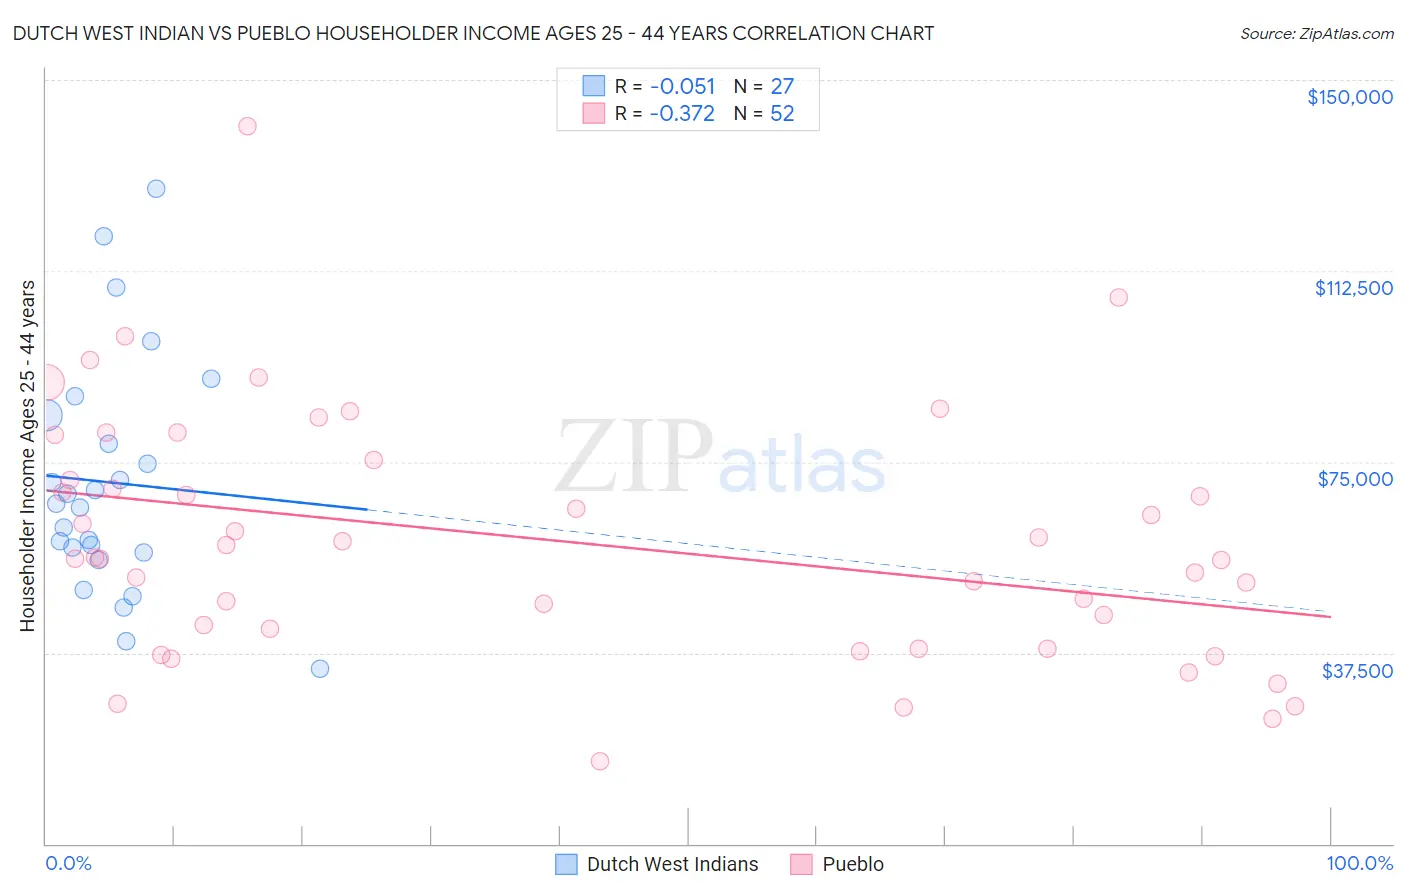
Dutch West Indian vs Pueblo Householder Income Ages 25 - 44 years Correlation Chart
The statistical analysis conducted on geographies consisting of 85,685,681 people shows a slight negative correlation between the proportion of Dutch West Indians and household income with householder between the ages 25 and 44 in the United States with a correlation coefficient (R) of -0.051 and weighted average of $77,260. Similarly, the statistical analysis conducted on geographies consisting of 119,922,511 people shows a mild negative correlation between the proportion of Pueblo and household income with householder between the ages 25 and 44 in the United States with a correlation coefficient (R) of -0.372 and weighted average of $68,910, a difference of 12.1%.
Householder Income Ages 25 - 44 years Correlation Summary
| Measurement | Dutch West Indian | Pueblo |
| Minimum | $34,250 | $16,125 |
| Maximum | $128,750 | $140,852 |
| Range | $94,500 | $124,727 |
| Mean | $70,946 | $59,480 |
| Median | $66,805 | $56,103 |
| Interquartile 25% (IQ1) | $57,188 | $40,297 |
| Interquartile 75% (IQ3) | $84,121 | $73,434 |
| Interquartile Range (IQR) | $26,933 | $33,137 |
| Standard Deviation (Sample) | $23,101 | $24,239 |
| Standard Deviation (Population) | $22,670 | $24,005 |
Demographics Similar to Dutch West Indians and Pueblo by Householder Income Ages 25 - 44 years
In terms of householder income ages 25 - 44 years, the demographic groups most similar to Dutch West Indians are Sioux ($77,089, a difference of 0.22%), Houma ($77,044, a difference of 0.28%), Immigrants from Bahamas ($76,910, a difference of 0.46%), Immigrants from Cuba ($76,701, a difference of 0.73%), and Seminole ($76,584, a difference of 0.88%). Similarly, the demographic groups most similar to Pueblo are Tohono O'odham ($69,068, a difference of 0.23%), Crow ($71,337, a difference of 3.5%), Arapaho ($71,697, a difference of 4.0%), Immigrants from Congo ($72,178, a difference of 4.7%), and Yuman ($72,956, a difference of 5.9%).
| Demographics | Rating | Rank | Householder Income Ages 25 - 44 years |
| Dutch West Indians | 0.0 /100 | #324 | Tragic $77,260 |
| Sioux | 0.0 /100 | #325 | Tragic $77,089 |
| Houma | 0.0 /100 | #326 | Tragic $77,044 |
| Immigrants | Bahamas | 0.0 /100 | #327 | Tragic $76,910 |
| Immigrants | Cuba | 0.0 /100 | #328 | Tragic $76,701 |
| Seminole | 0.0 /100 | #329 | Tragic $76,584 |
| Yakama | 0.0 /100 | #330 | Tragic $76,226 |
| Natives/Alaskans | 0.0 /100 | #331 | Tragic $75,647 |
| Bahamians | 0.0 /100 | #332 | Tragic $75,395 |
| Hopi | 0.0 /100 | #333 | Tragic $75,002 |
| Creek | 0.0 /100 | #334 | Tragic $74,847 |
| Kiowa | 0.0 /100 | #335 | Tragic $74,776 |
| Yup'ik | 0.0 /100 | #336 | Tragic $73,688 |
| Blacks/African Americans | 0.0 /100 | #337 | Tragic $73,370 |
| Immigrants | Yemen | 0.0 /100 | #338 | Tragic $73,043 |
| Yuman | 0.0 /100 | #339 | Tragic $72,956 |
| Immigrants | Congo | 0.0 /100 | #340 | Tragic $72,178 |
| Arapaho | 0.0 /100 | #341 | Tragic $71,697 |
| Crow | 0.0 /100 | #342 | Tragic $71,337 |
| Tohono O'odham | 0.0 /100 | #343 | Tragic $69,068 |
| Pueblo | 0.0 /100 | #344 | Tragic $68,910 |