Dutch West Indian vs Immigrants from Afghanistan Single Male Poverty
COMPARE
Dutch West Indian
Immigrants from Afghanistan
Single Male Poverty
Single Male Poverty Comparison
Dutch West Indians
Immigrants from Afghanistan
16.1%
SINGLE MALE POVERTY
0.0/ 100
METRIC RATING
316th/ 347
METRIC RANK
10.9%
SINGLE MALE POVERTY
100.0/ 100
METRIC RATING
12th/ 347
METRIC RANK
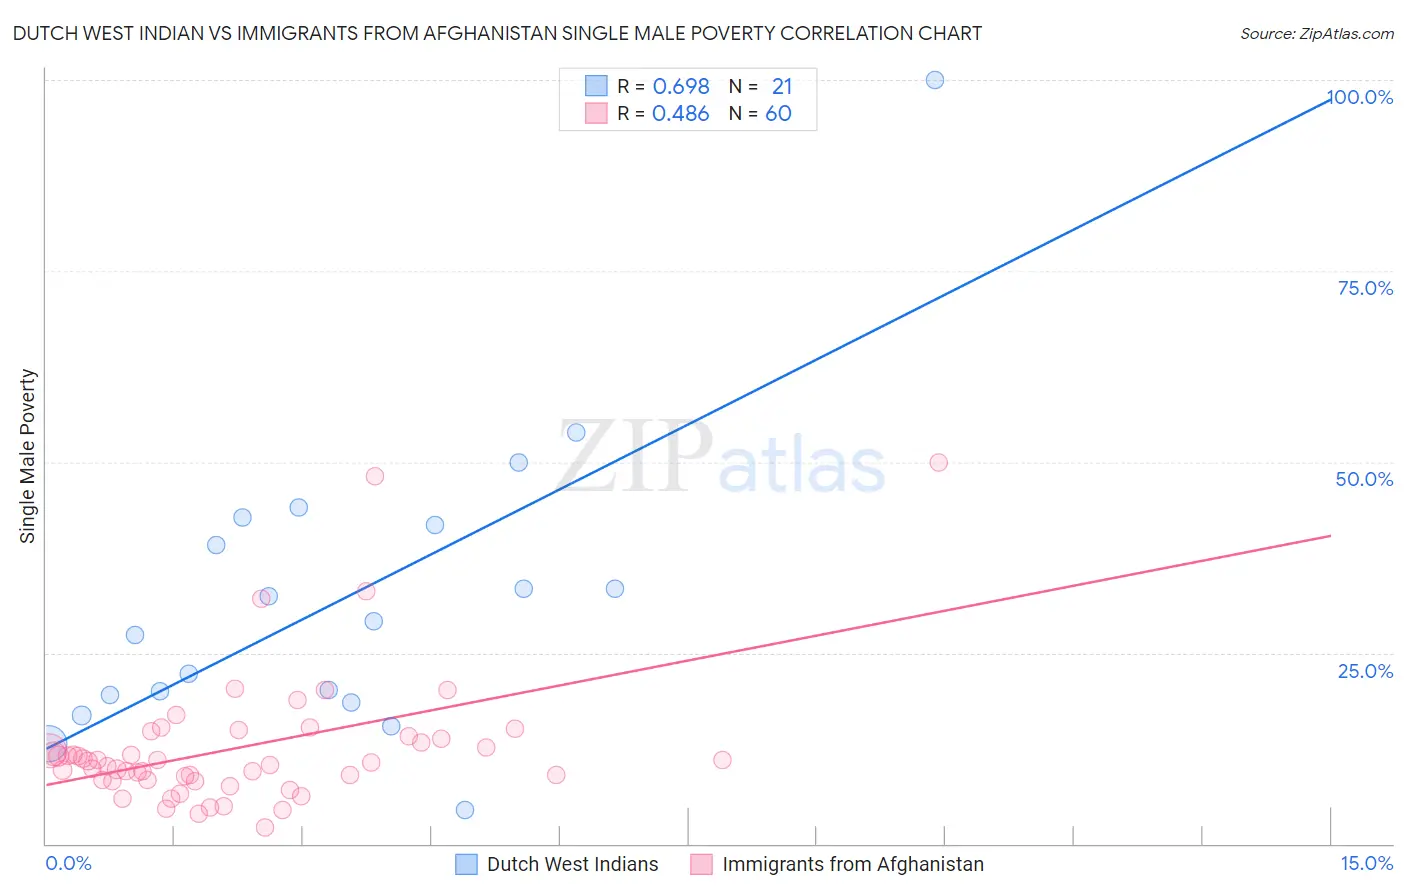
Dutch West Indian vs Immigrants from Afghanistan Single Male Poverty Correlation Chart
The statistical analysis conducted on geographies consisting of 82,367,867 people shows a significant positive correlation between the proportion of Dutch West Indians and poverty level among single males in the United States with a correlation coefficient (R) of 0.698 and weighted average of 16.1%. Similarly, the statistical analysis conducted on geographies consisting of 139,212,211 people shows a moderate positive correlation between the proportion of Immigrants from Afghanistan and poverty level among single males in the United States with a correlation coefficient (R) of 0.486 and weighted average of 10.9%, a difference of 47.9%.
Single Male Poverty Correlation Summary
| Measurement | Dutch West Indian | Immigrants from Afghanistan |
| Minimum | 4.5% | 2.2% |
| Maximum | 100.0% | 50.0% |
| Range | 95.5% | 47.8% |
| Mean | 32.3% | 12.6% |
| Median | 29.1% | 10.7% |
| Interquartile 25% (IQ1) | 19.0% | 8.3% |
| Interquartile 75% (IQ3) | 42.3% | 14.0% |
| Interquartile Range (IQR) | 23.3% | 5.6% |
| Standard Deviation (Sample) | 20.2% | 8.8% |
| Standard Deviation (Population) | 19.8% | 8.8% |
Similar Demographics by Single Male Poverty
Demographics Similar to Dutch West Indians by Single Male Poverty
In terms of single male poverty, the demographic groups most similar to Dutch West Indians are Cheyenne (16.1%, a difference of 0.14%), Alaskan Athabascan (16.1%, a difference of 0.19%), Black/African American (16.2%, a difference of 0.34%), Cherokee (16.1%, a difference of 0.48%), and Seminole (16.0%, a difference of 0.71%).
| Demographics | Rating | Rank | Single Male Poverty |
| Americans | 0.0 /100 | #309 | Tragic 15.8% |
| Yakama | 0.0 /100 | #310 | Tragic 15.9% |
| Seminole | 0.0 /100 | #311 | Tragic 16.0% |
| Comanche | 0.0 /100 | #312 | Tragic 16.0% |
| Cherokee | 0.0 /100 | #313 | Tragic 16.1% |
| Alaskan Athabascans | 0.0 /100 | #314 | Tragic 16.1% |
| Cheyenne | 0.0 /100 | #315 | Tragic 16.1% |
| Dutch West Indians | 0.0 /100 | #316 | Tragic 16.1% |
| Blacks/African Americans | 0.0 /100 | #317 | Tragic 16.2% |
| Chickasaw | 0.0 /100 | #318 | Tragic 16.3% |
| Chippewa | 0.0 /100 | #319 | Tragic 16.4% |
| Marshallese | 0.0 /100 | #320 | Tragic 16.4% |
| Osage | 0.0 /100 | #321 | Tragic 16.5% |
| Shoshone | 0.0 /100 | #322 | Tragic 16.7% |
| Creek | 0.0 /100 | #323 | Tragic 16.8% |
Demographics Similar to Immigrants from Afghanistan by Single Male Poverty
In terms of single male poverty, the demographic groups most similar to Immigrants from Afghanistan are Immigrants from Philippines (10.9%, a difference of 0.070%), Immigrants from Fiji (10.9%, a difference of 0.090%), Immigrants from South Central Asia (10.9%, a difference of 0.12%), Taiwanese (10.9%, a difference of 0.15%), and Chinese (11.0%, a difference of 0.69%).
| Demographics | Rating | Rank | Single Male Poverty |
| Tongans | 100.0 /100 | #5 | Exceptional 10.5% |
| Filipinos | 100.0 /100 | #6 | Exceptional 10.6% |
| Afghans | 100.0 /100 | #7 | Exceptional 10.7% |
| Thais | 100.0 /100 | #8 | Exceptional 10.8% |
| Taiwanese | 100.0 /100 | #9 | Exceptional 10.9% |
| Immigrants | Fiji | 100.0 /100 | #10 | Exceptional 10.9% |
| Immigrants | Philippines | 100.0 /100 | #11 | Exceptional 10.9% |
| Immigrants | Afghanistan | 100.0 /100 | #12 | Exceptional 10.9% |
| Immigrants | South Central Asia | 100.0 /100 | #13 | Exceptional 10.9% |
| Chinese | 100.0 /100 | #14 | Exceptional 11.0% |
| Koreans | 100.0 /100 | #15 | Exceptional 11.0% |
| Bhutanese | 100.0 /100 | #16 | Exceptional 11.1% |
| Tsimshian | 100.0 /100 | #17 | Exceptional 11.1% |
| Immigrants | Bolivia | 100.0 /100 | #18 | Exceptional 11.1% |
| Immigrants | Moldova | 100.0 /100 | #19 | Exceptional 11.2% |