Dominican vs Mexican American Indian Male Poverty
COMPARE
Dominican
Mexican American Indian
Male Poverty
Male Poverty Comparison
Dominicans
Mexican American Indians
16.1%
MALE POVERTY
0.0/ 100
METRIC RATING
329th/ 347
METRIC RANK
13.0%
MALE POVERTY
0.1/ 100
METRIC RATING
254th/ 347
METRIC RANK
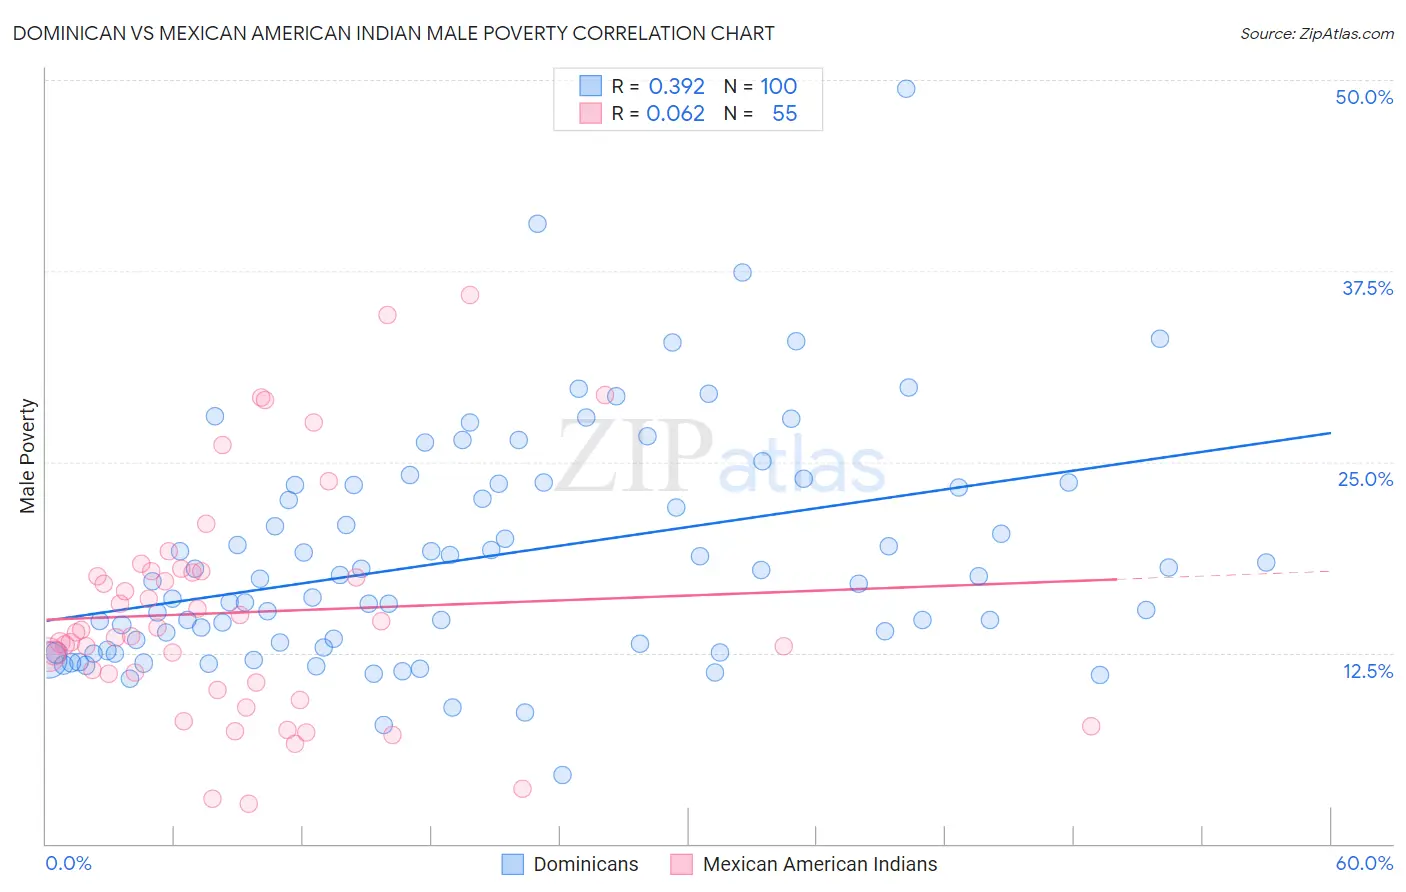
Dominican vs Mexican American Indian Male Poverty Correlation Chart
The statistical analysis conducted on geographies consisting of 354,651,464 people shows a mild positive correlation between the proportion of Dominicans and poverty level among males in the United States with a correlation coefficient (R) of 0.392 and weighted average of 16.1%. Similarly, the statistical analysis conducted on geographies consisting of 317,482,192 people shows a slight positive correlation between the proportion of Mexican American Indians and poverty level among males in the United States with a correlation coefficient (R) of 0.062 and weighted average of 13.0%, a difference of 23.9%.
Male Poverty Correlation Summary
| Measurement | Dominican | Mexican American Indian |
| Minimum | 4.5% | 2.6% |
| Maximum | 49.4% | 35.9% |
| Range | 44.9% | 33.3% |
| Mean | 18.7% | 15.1% |
| Median | 17.2% | 13.8% |
| Interquartile 25% (IQ1) | 13.0% | 10.6% |
| Interquartile 75% (IQ3) | 23.5% | 17.8% |
| Interquartile Range (IQR) | 10.5% | 7.2% |
| Standard Deviation (Sample) | 7.5% | 7.4% |
| Standard Deviation (Population) | 7.5% | 7.3% |
Similar Demographics by Male Poverty
Demographics Similar to Dominicans by Male Poverty
In terms of male poverty, the demographic groups most similar to Dominicans are Immigrants from Dominican Republic (16.2%, a difference of 0.65%), Ute (16.2%, a difference of 0.99%), Black/African American (15.8%, a difference of 1.7%), Paiute (15.8%, a difference of 1.8%), and Houma (16.7%, a difference of 4.0%).
| Demographics | Rating | Rank | Male Poverty |
| Kiowa | 0.0 /100 | #322 | Tragic 15.2% |
| Colville | 0.0 /100 | #323 | Tragic 15.2% |
| Menominee | 0.0 /100 | #324 | Tragic 15.3% |
| Yakama | 0.0 /100 | #325 | Tragic 15.3% |
| Central American Indians | 0.0 /100 | #326 | Tragic 15.3% |
| Paiute | 0.0 /100 | #327 | Tragic 15.8% |
| Blacks/African Americans | 0.0 /100 | #328 | Tragic 15.8% |
| Dominicans | 0.0 /100 | #329 | Tragic 16.1% |
| Immigrants | Dominican Republic | 0.0 /100 | #330 | Tragic 16.2% |
| Ute | 0.0 /100 | #331 | Tragic 16.2% |
| Houma | 0.0 /100 | #332 | Tragic 16.7% |
| Natives/Alaskans | 0.0 /100 | #333 | Tragic 16.9% |
| Cheyenne | 0.0 /100 | #334 | Tragic 17.6% |
| Apache | 0.0 /100 | #335 | Tragic 17.7% |
| Pueblo | 0.0 /100 | #336 | Tragic 18.5% |
Demographics Similar to Mexican American Indians by Male Poverty
In terms of male poverty, the demographic groups most similar to Mexican American Indians are Immigrants from Liberia (13.0%, a difference of 0.090%), Immigrants from Burma/Myanmar (13.0%, a difference of 0.29%), Immigrants from Ghana (12.9%, a difference of 0.39%), Immigrants from Ecuador (12.9%, a difference of 0.44%), and Immigrants from Cuba (12.9%, a difference of 0.47%).
| Demographics | Rating | Rank | Male Poverty |
| Immigrants | Western Africa | 0.2 /100 | #247 | Tragic 12.9% |
| Immigrants | Sudan | 0.2 /100 | #248 | Tragic 12.9% |
| Potawatomi | 0.2 /100 | #249 | Tragic 12.9% |
| Immigrants | Nicaragua | 0.2 /100 | #250 | Tragic 12.9% |
| Immigrants | Cuba | 0.2 /100 | #251 | Tragic 12.9% |
| Immigrants | Ecuador | 0.2 /100 | #252 | Tragic 12.9% |
| Immigrants | Ghana | 0.2 /100 | #253 | Tragic 12.9% |
| Mexican American Indians | 0.1 /100 | #254 | Tragic 13.0% |
| Immigrants | Liberia | 0.1 /100 | #255 | Tragic 13.0% |
| Immigrants | Burma/Myanmar | 0.1 /100 | #256 | Tragic 13.0% |
| Immigrants | Trinidad and Tobago | 0.1 /100 | #257 | Tragic 13.1% |
| Cape Verdeans | 0.1 /100 | #258 | Tragic 13.1% |
| Cherokee | 0.1 /100 | #259 | Tragic 13.1% |
| Ottawa | 0.1 /100 | #260 | Tragic 13.1% |
| Trinidadians and Tobagonians | 0.1 /100 | #261 | Tragic 13.1% |