Dominican vs Mexican American Indian Seniors Poverty Over the Age of 75
COMPARE
Dominican
Mexican American Indian
Seniors Poverty Over the Age of 75
Seniors Poverty Over the Age of 75 Comparison
Dominicans
Mexican American Indians
19.6%
SENIORS POVERTY OVER THE AGE OF 75
0.0/ 100
METRIC RATING
342nd/ 347
METRIC RANK
13.6%
SENIORS POVERTY OVER THE AGE OF 75
0.3/ 100
METRIC RATING
250th/ 347
METRIC RANK
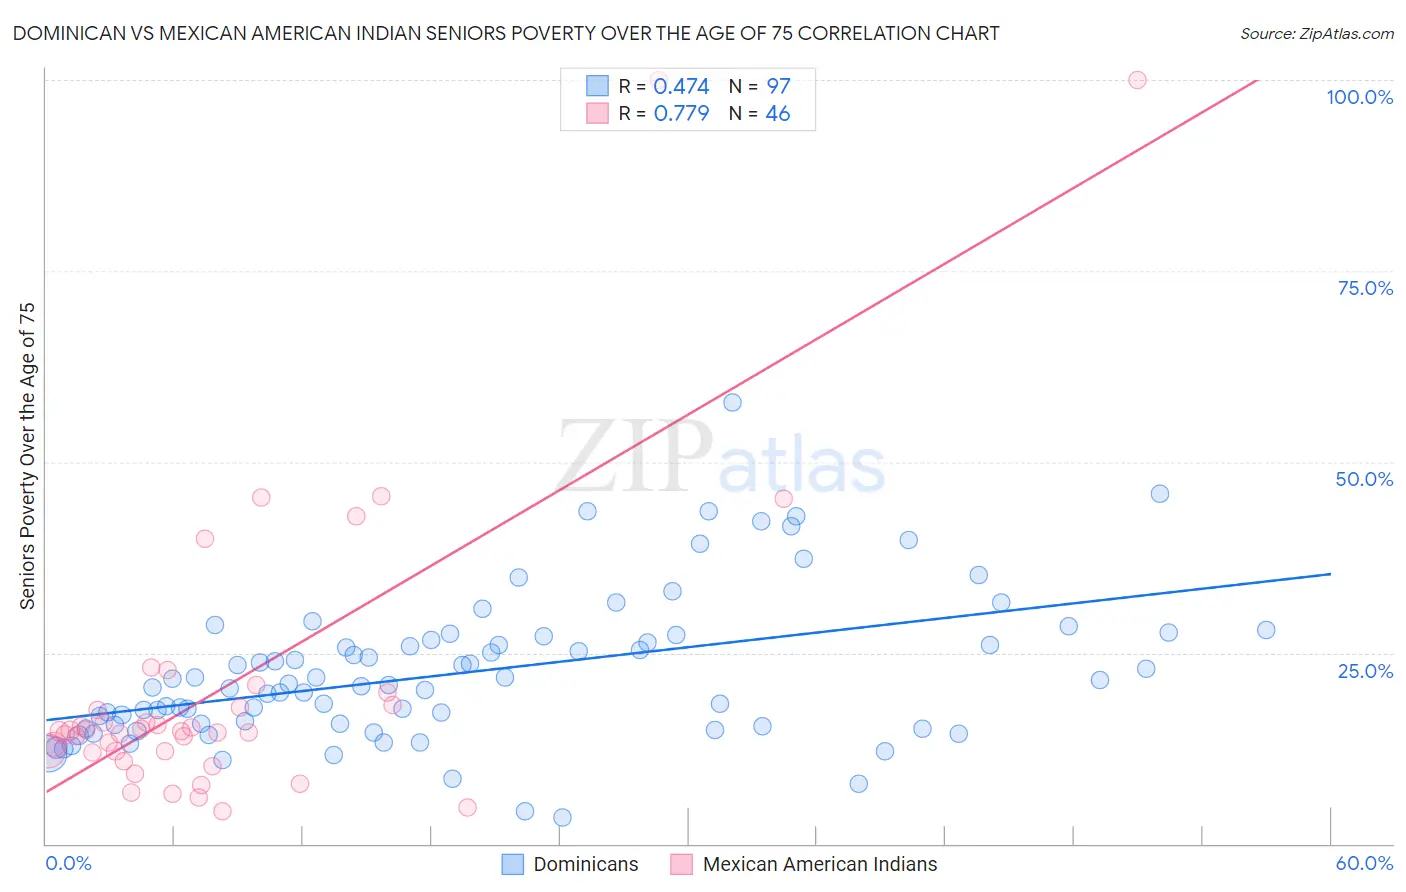
Dominican vs Mexican American Indian Seniors Poverty Over the Age of 75 Correlation Chart
The statistical analysis conducted on geographies consisting of 350,851,052 people shows a moderate positive correlation between the proportion of Dominicans and poverty level among seniors over the age of 75 in the United States with a correlation coefficient (R) of 0.474 and weighted average of 19.6%. Similarly, the statistical analysis conducted on geographies consisting of 314,926,710 people shows a strong positive correlation between the proportion of Mexican American Indians and poverty level among seniors over the age of 75 in the United States with a correlation coefficient (R) of 0.779 and weighted average of 13.6%, a difference of 44.1%.
Seniors Poverty Over the Age of 75 Correlation Summary
| Measurement | Dominican | Mexican American Indian |
| Minimum | 3.4% | 4.2% |
| Maximum | 57.7% | 100.0% |
| Range | 54.4% | 95.8% |
| Mean | 22.5% | 20.6% |
| Median | 20.8% | 14.7% |
| Interquartile 25% (IQ1) | 15.5% | 12.1% |
| Interquartile 75% (IQ3) | 27.0% | 18.1% |
| Interquartile Range (IQR) | 11.5% | 6.1% |
| Standard Deviation (Sample) | 9.7% | 20.0% |
| Standard Deviation (Population) | 9.6% | 19.8% |
Similar Demographics by Seniors Poverty Over the Age of 75
Demographics Similar to Dominicans by Seniors Poverty Over the Age of 75
In terms of seniors poverty over the age of 75, the demographic groups most similar to Dominicans are Lumbee (19.7%, a difference of 0.66%), Navajo (19.4%, a difference of 1.2%), Immigrants from Cuba (19.9%, a difference of 1.5%), Immigrants from Dominican Republic (20.1%, a difference of 2.2%), and Tohono O'odham (19.1%, a difference of 2.5%).
| Demographics | Rating | Rank | Seniors Poverty Over the Age of 75 |
| Immigrants | Nicaragua | 0.0 /100 | #333 | Tragic 17.6% |
| Immigrants | Grenada | 0.0 /100 | #334 | Tragic 17.8% |
| Cubans | 0.0 /100 | #335 | Tragic 18.0% |
| Immigrants | Caribbean | 0.0 /100 | #336 | Tragic 18.2% |
| Yakama | 0.0 /100 | #337 | Tragic 18.3% |
| Immigrants | Cabo Verde | 0.0 /100 | #338 | Tragic 18.5% |
| Hopi | 0.0 /100 | #339 | Tragic 18.9% |
| Tohono O'odham | 0.0 /100 | #340 | Tragic 19.1% |
| Navajo | 0.0 /100 | #341 | Tragic 19.4% |
| Dominicans | 0.0 /100 | #342 | Tragic 19.6% |
| Lumbee | 0.0 /100 | #343 | Tragic 19.7% |
| Immigrants | Cuba | 0.0 /100 | #344 | Tragic 19.9% |
| Immigrants | Dominican Republic | 0.0 /100 | #345 | Tragic 20.1% |
| Puerto Ricans | 0.0 /100 | #346 | Tragic 23.2% |
| Pima | 0.0 /100 | #347 | Tragic 23.9% |
Demographics Similar to Mexican American Indians by Seniors Poverty Over the Age of 75
In terms of seniors poverty over the age of 75, the demographic groups most similar to Mexican American Indians are Immigrants from Albania (13.6%, a difference of 0.010%), African (13.6%, a difference of 0.020%), Immigrants from Ukraine (13.6%, a difference of 0.050%), Immigrants from Peru (13.7%, a difference of 0.33%), and Immigrants from Argentina (13.7%, a difference of 0.38%).
| Demographics | Rating | Rank | Seniors Poverty Over the Age of 75 |
| Dutch West Indians | 0.6 /100 | #243 | Tragic 13.5% |
| Spanish Americans | 0.5 /100 | #244 | Tragic 13.5% |
| Uruguayans | 0.5 /100 | #245 | Tragic 13.5% |
| Immigrants | Cambodia | 0.4 /100 | #246 | Tragic 13.6% |
| Immigrants | Ukraine | 0.3 /100 | #247 | Tragic 13.6% |
| Africans | 0.3 /100 | #248 | Tragic 13.6% |
| Immigrants | Albania | 0.3 /100 | #249 | Tragic 13.6% |
| Mexican American Indians | 0.3 /100 | #250 | Tragic 13.6% |
| Immigrants | Peru | 0.3 /100 | #251 | Tragic 13.7% |
| Immigrants | Argentina | 0.3 /100 | #252 | Tragic 13.7% |
| Immigrants | Spain | 0.2 /100 | #253 | Tragic 13.7% |
| Blackfeet | 0.2 /100 | #254 | Tragic 13.7% |
| Immigrants | Belarus | 0.2 /100 | #255 | Tragic 13.8% |
| Inupiat | 0.1 /100 | #256 | Tragic 13.8% |
| Immigrants | Western Africa | 0.1 /100 | #257 | Tragic 13.9% |