Dominican vs Costa Rican Male Poverty
COMPARE
Dominican
Costa Rican
Male Poverty
Male Poverty Comparison
Dominicans
Costa Ricans
16.1%
MALE POVERTY
0.0/ 100
METRIC RATING
329th/ 347
METRIC RANK
11.0%
MALE POVERTY
63.9/ 100
METRIC RATING
156th/ 347
METRIC RANK
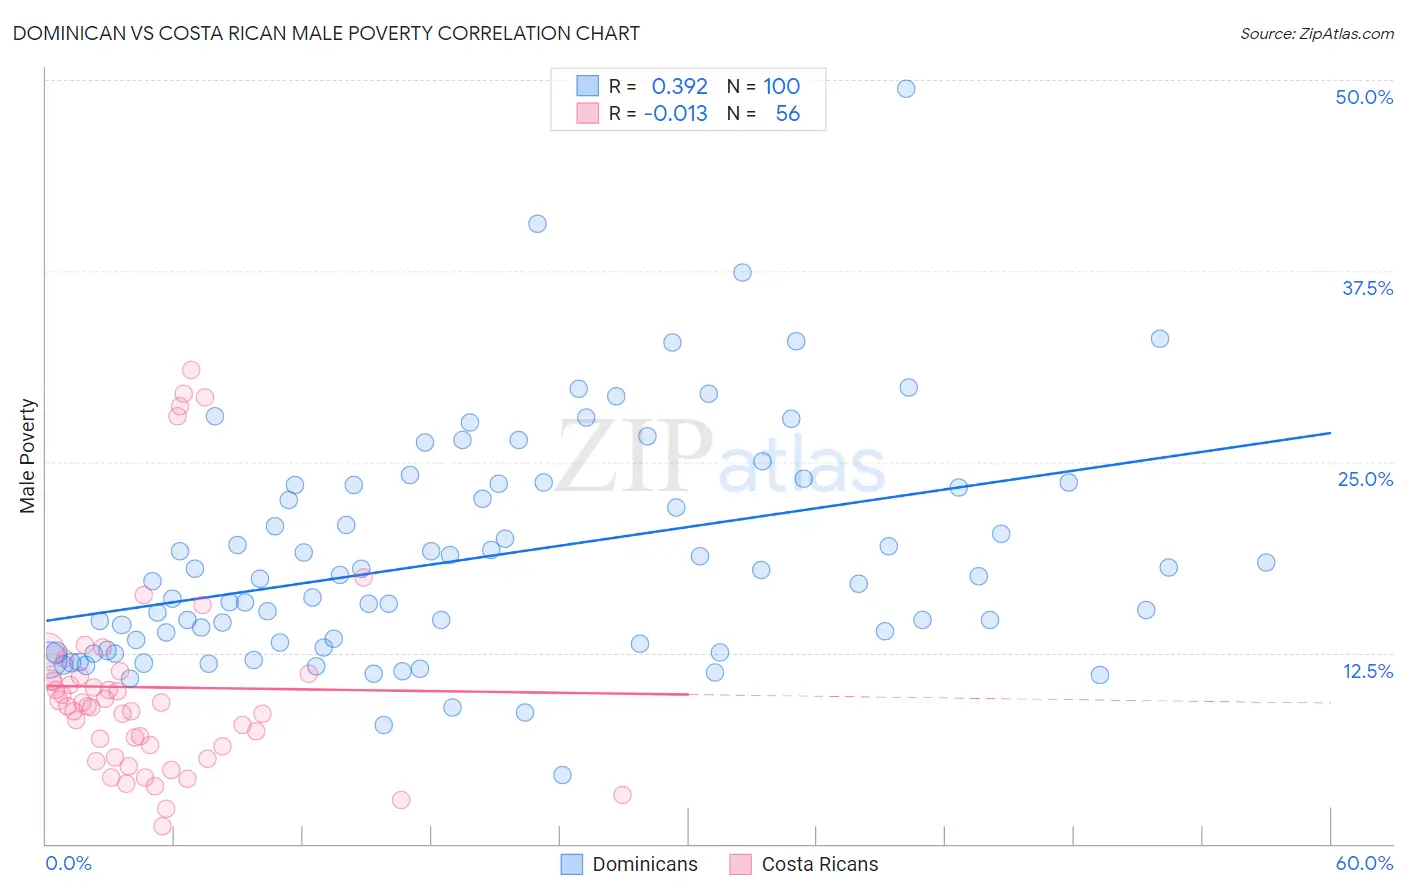
Dominican vs Costa Rican Male Poverty Correlation Chart
The statistical analysis conducted on geographies consisting of 354,651,464 people shows a mild positive correlation between the proportion of Dominicans and poverty level among males in the United States with a correlation coefficient (R) of 0.392 and weighted average of 16.1%. Similarly, the statistical analysis conducted on geographies consisting of 253,451,633 people shows no correlation between the proportion of Costa Ricans and poverty level among males in the United States with a correlation coefficient (R) of -0.013 and weighted average of 11.0%, a difference of 45.8%.
Male Poverty Correlation Summary
| Measurement | Dominican | Costa Rican |
| Minimum | 4.5% | 1.1% |
| Maximum | 49.4% | 31.0% |
| Range | 44.9% | 29.8% |
| Mean | 18.7% | 10.2% |
| Median | 17.2% | 9.0% |
| Interquartile 25% (IQ1) | 13.0% | 6.0% |
| Interquartile 75% (IQ3) | 23.5% | 11.0% |
| Interquartile Range (IQR) | 10.5% | 5.0% |
| Standard Deviation (Sample) | 7.5% | 6.9% |
| Standard Deviation (Population) | 7.5% | 6.8% |
Similar Demographics by Male Poverty
Demographics Similar to Dominicans by Male Poverty
In terms of male poverty, the demographic groups most similar to Dominicans are Immigrants from Dominican Republic (16.2%, a difference of 0.65%), Ute (16.2%, a difference of 0.99%), Black/African American (15.8%, a difference of 1.7%), Paiute (15.8%, a difference of 1.8%), and Houma (16.7%, a difference of 4.0%).
| Demographics | Rating | Rank | Male Poverty |
| Kiowa | 0.0 /100 | #322 | Tragic 15.2% |
| Colville | 0.0 /100 | #323 | Tragic 15.2% |
| Menominee | 0.0 /100 | #324 | Tragic 15.3% |
| Yakama | 0.0 /100 | #325 | Tragic 15.3% |
| Central American Indians | 0.0 /100 | #326 | Tragic 15.3% |
| Paiute | 0.0 /100 | #327 | Tragic 15.8% |
| Blacks/African Americans | 0.0 /100 | #328 | Tragic 15.8% |
| Dominicans | 0.0 /100 | #329 | Tragic 16.1% |
| Immigrants | Dominican Republic | 0.0 /100 | #330 | Tragic 16.2% |
| Ute | 0.0 /100 | #331 | Tragic 16.2% |
| Houma | 0.0 /100 | #332 | Tragic 16.7% |
| Natives/Alaskans | 0.0 /100 | #333 | Tragic 16.9% |
| Cheyenne | 0.0 /100 | #334 | Tragic 17.6% |
| Apache | 0.0 /100 | #335 | Tragic 17.7% |
| Pueblo | 0.0 /100 | #336 | Tragic 18.5% |
Demographics Similar to Costa Ricans by Male Poverty
In terms of male poverty, the demographic groups most similar to Costa Ricans are Scotch-Irish (11.0%, a difference of 0.020%), Immigrants from Malaysia (11.0%, a difference of 0.090%), Immigrants from Kazakhstan (11.0%, a difference of 0.10%), Colombian (11.0%, a difference of 0.10%), and Taiwanese (11.0%, a difference of 0.12%).
| Demographics | Rating | Rank | Male Poverty |
| Immigrants | Venezuela | 67.9 /100 | #149 | Good 11.0% |
| Guamanians/Chamorros | 67.6 /100 | #150 | Good 11.0% |
| Venezuelans | 67.4 /100 | #151 | Good 11.0% |
| Immigrants | Nepal | 67.3 /100 | #152 | Good 11.0% |
| Immigrants | Bosnia and Herzegovina | 65.2 /100 | #153 | Good 11.0% |
| Immigrants | Kazakhstan | 64.8 /100 | #154 | Good 11.0% |
| Immigrants | Malaysia | 64.7 /100 | #155 | Good 11.0% |
| Costa Ricans | 63.9 /100 | #156 | Good 11.0% |
| Scotch-Irish | 63.7 /100 | #157 | Good 11.0% |
| Colombians | 63.0 /100 | #158 | Good 11.0% |
| Taiwanese | 62.7 /100 | #159 | Good 11.0% |
| Soviet Union | 60.3 /100 | #160 | Good 11.1% |
| Immigrants | Northern Africa | 59.7 /100 | #161 | Average 11.1% |
| Immigrants | Chile | 57.4 /100 | #162 | Average 11.1% |
| Whites/Caucasians | 56.7 /100 | #163 | Average 11.1% |