Dominican vs Panamanian Single Male Poverty
COMPARE
Dominican
Panamanian
Single Male Poverty
Single Male Poverty Comparison
Dominicans
Panamanians
15.2%
SINGLE MALE POVERTY
0.0/ 100
METRIC RATING
301st/ 347
METRIC RANK
12.9%
SINGLE MALE POVERTY
37.6/ 100
METRIC RATING
181st/ 347
METRIC RANK
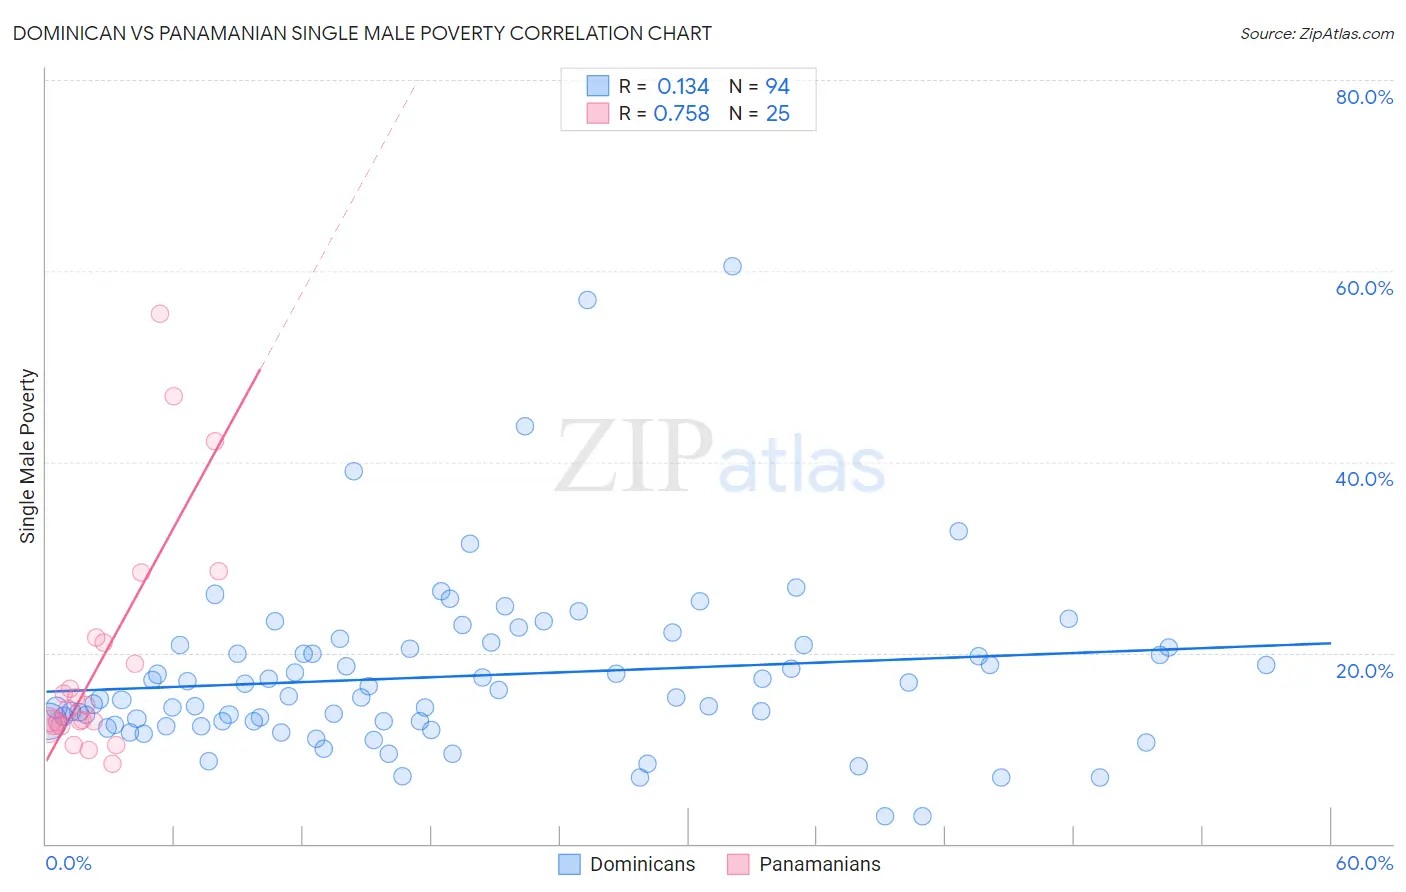
Dominican vs Panamanian Single Male Poverty Correlation Chart
The statistical analysis conducted on geographies consisting of 318,233,165 people shows a poor positive correlation between the proportion of Dominicans and poverty level among single males in the United States with a correlation coefficient (R) of 0.134 and weighted average of 15.2%. Similarly, the statistical analysis conducted on geographies consisting of 259,773,019 people shows a strong positive correlation between the proportion of Panamanians and poverty level among single males in the United States with a correlation coefficient (R) of 0.758 and weighted average of 12.9%, a difference of 18.1%.
Single Male Poverty Correlation Summary
| Measurement | Dominican | Panamanian |
| Minimum | 2.9% | 8.3% |
| Maximum | 60.5% | 55.6% |
| Range | 57.6% | 47.2% |
| Mean | 17.6% | 19.2% |
| Median | 15.4% | 14.1% |
| Interquartile 25% (IQ1) | 12.8% | 12.4% |
| Interquartile 75% (IQ3) | 20.6% | 21.4% |
| Interquartile Range (IQR) | 7.8% | 8.9% |
| Standard Deviation (Sample) | 9.1% | 12.2% |
| Standard Deviation (Population) | 9.1% | 12.0% |
Similar Demographics by Single Male Poverty
Demographics Similar to Dominicans by Single Male Poverty
In terms of single male poverty, the demographic groups most similar to Dominicans are Alsatian (15.2%, a difference of 0.16%), Cree (15.1%, a difference of 0.82%), Aleut (15.4%, a difference of 1.2%), Delaware (15.0%, a difference of 1.3%), and Alaska Native (15.4%, a difference of 1.3%).
| Demographics | Rating | Rank | Single Male Poverty |
| Ottawa | 0.0 /100 | #294 | Tragic 14.6% |
| Scotch-Irish | 0.0 /100 | #295 | Tragic 14.7% |
| Africans | 0.0 /100 | #296 | Tragic 14.7% |
| Immigrants | Dominican Republic | 0.0 /100 | #297 | Tragic 14.8% |
| French American Indians | 0.0 /100 | #298 | Tragic 15.0% |
| Delaware | 0.0 /100 | #299 | Tragic 15.0% |
| Cree | 0.0 /100 | #300 | Tragic 15.1% |
| Dominicans | 0.0 /100 | #301 | Tragic 15.2% |
| Alsatians | 0.0 /100 | #302 | Tragic 15.2% |
| Aleuts | 0.0 /100 | #303 | Tragic 15.4% |
| Alaska Natives | 0.0 /100 | #304 | Tragic 15.4% |
| Blackfeet | 0.0 /100 | #305 | Tragic 15.5% |
| Pennsylvania Germans | 0.0 /100 | #306 | Tragic 15.6% |
| Ute | 0.0 /100 | #307 | Tragic 15.7% |
| Potawatomi | 0.0 /100 | #308 | Tragic 15.8% |
Demographics Similar to Panamanians by Single Male Poverty
In terms of single male poverty, the demographic groups most similar to Panamanians are Immigrants from North America (12.9%, a difference of 0.010%), Moroccan (12.9%, a difference of 0.040%), Israeli (12.9%, a difference of 0.19%), Immigrants from West Indies (12.9%, a difference of 0.26%), and Immigrants from Trinidad and Tobago (12.9%, a difference of 0.29%).
| Demographics | Rating | Rank | Single Male Poverty |
| Costa Ricans | 50.0 /100 | #174 | Average 12.8% |
| Croatians | 48.9 /100 | #175 | Average 12.8% |
| Syrians | 48.4 /100 | #176 | Average 12.8% |
| Immigrants | Canada | 44.8 /100 | #177 | Average 12.8% |
| Immigrants | Switzerland | 43.1 /100 | #178 | Average 12.8% |
| Israelis | 41.0 /100 | #179 | Average 12.9% |
| Immigrants | North America | 37.7 /100 | #180 | Fair 12.9% |
| Panamanians | 37.6 /100 | #181 | Fair 12.9% |
| Moroccans | 36.8 /100 | #182 | Fair 12.9% |
| Immigrants | West Indies | 33.0 /100 | #183 | Fair 12.9% |
| Immigrants | Trinidad and Tobago | 32.5 /100 | #184 | Fair 12.9% |
| Norwegians | 32.0 /100 | #185 | Fair 12.9% |
| Nigerians | 31.9 /100 | #186 | Fair 12.9% |
| Immigrants | Kuwait | 31.9 /100 | #187 | Fair 12.9% |
| Macedonians | 31.5 /100 | #188 | Fair 12.9% |