Immigrants from Caribbean vs Greek Single Mother Poverty
COMPARE
Immigrants from Caribbean
Greek
Single Mother Poverty
Single Mother Poverty Comparison
Immigrants from Caribbean
Greeks
31.1%
SINGLE MOTHER POVERTY
0.4/ 100
METRIC RATING
258th/ 347
METRIC RANK
27.7%
SINGLE MOTHER POVERTY
98.7/ 100
METRIC RATING
83rd/ 347
METRIC RANK
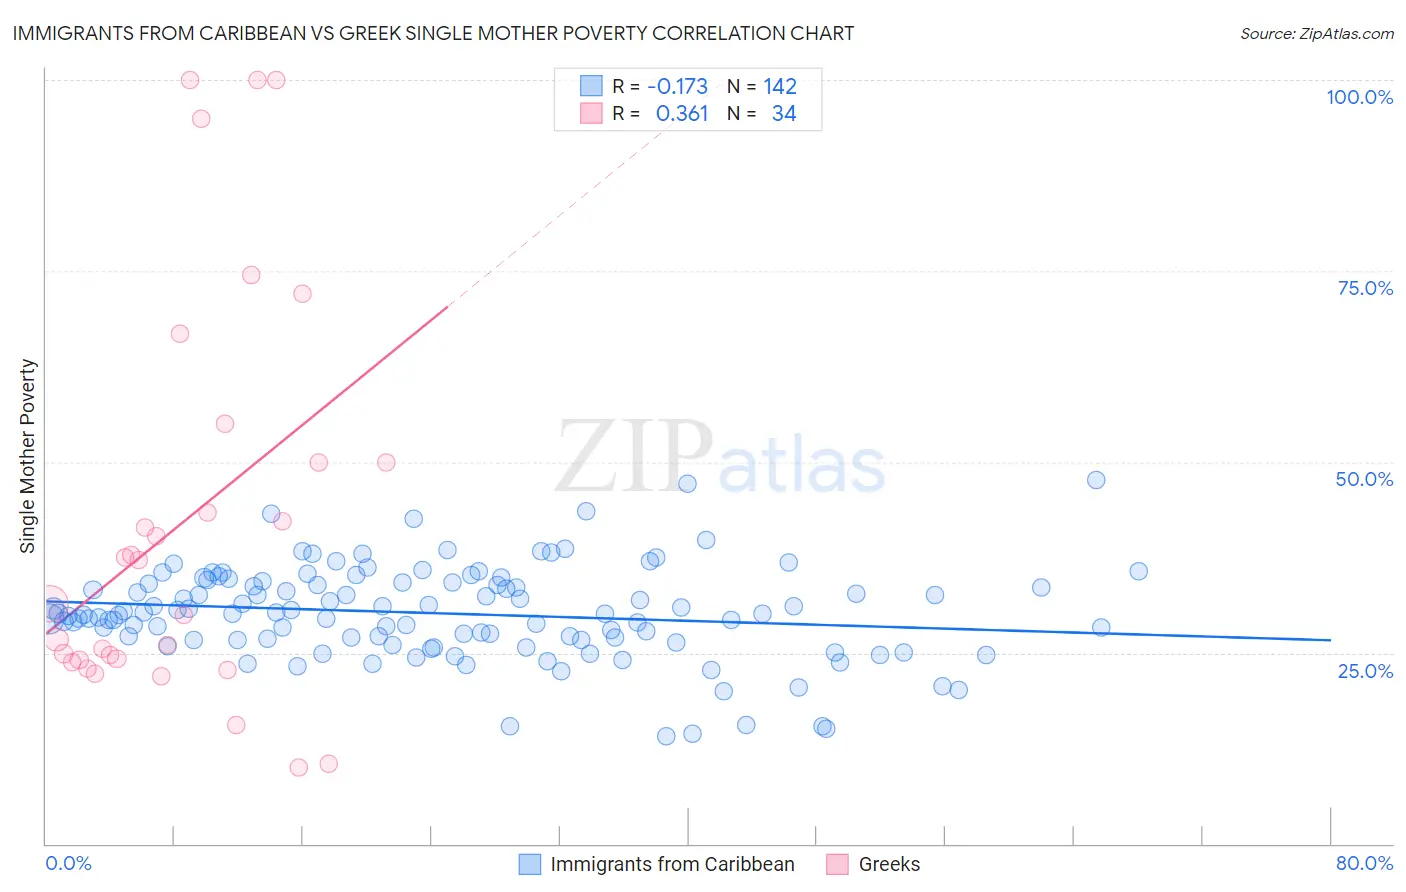
Immigrants from Caribbean vs Greek Single Mother Poverty Correlation Chart
The statistical analysis conducted on geographies consisting of 437,361,394 people shows a poor negative correlation between the proportion of Immigrants from Caribbean and poverty level among single mothers in the United States with a correlation coefficient (R) of -0.173 and weighted average of 31.1%. Similarly, the statistical analysis conducted on geographies consisting of 465,143,502 people shows a mild positive correlation between the proportion of Greeks and poverty level among single mothers in the United States with a correlation coefficient (R) of 0.361 and weighted average of 27.7%, a difference of 12.5%.
Single Mother Poverty Correlation Summary
| Measurement | Immigrants from Caribbean | Greek |
| Minimum | 14.1% | 10.0% |
| Maximum | 47.6% | 100.0% |
| Range | 33.5% | 90.0% |
| Mean | 30.2% | 42.1% |
| Median | 30.1% | 34.3% |
| Interquartile 25% (IQ1) | 26.7% | 24.1% |
| Interquartile 75% (IQ3) | 34.2% | 50.0% |
| Interquartile Range (IQR) | 7.4% | 25.9% |
| Standard Deviation (Sample) | 6.1% | 26.2% |
| Standard Deviation (Population) | 6.0% | 25.8% |
Similar Demographics by Single Mother Poverty
Demographics Similar to Immigrants from Caribbean by Single Mother Poverty
In terms of single mother poverty, the demographic groups most similar to Immigrants from Caribbean are Immigrants from Bangladesh (31.1%, a difference of 0.030%), Immigrants from Bahamas (31.1%, a difference of 0.090%), Immigrants from West Indies (31.1%, a difference of 0.13%), White/Caucasian (31.2%, a difference of 0.19%), and Immigrants from El Salvador (31.2%, a difference of 0.27%).
| Demographics | Rating | Rank | Single Mother Poverty |
| Tlingit-Haida | 0.6 /100 | #251 | Tragic 30.9% |
| Alaska Natives | 0.6 /100 | #252 | Tragic 30.9% |
| Celtics | 0.6 /100 | #253 | Tragic 30.9% |
| Senegalese | 0.5 /100 | #254 | Tragic 31.0% |
| Belizeans | 0.5 /100 | #255 | Tragic 31.0% |
| Immigrants | West Indies | 0.4 /100 | #256 | Tragic 31.1% |
| Immigrants | Bahamas | 0.4 /100 | #257 | Tragic 31.1% |
| Immigrants | Caribbean | 0.4 /100 | #258 | Tragic 31.1% |
| Immigrants | Bangladesh | 0.4 /100 | #259 | Tragic 31.1% |
| Whites/Caucasians | 0.3 /100 | #260 | Tragic 31.2% |
| Immigrants | El Salvador | 0.3 /100 | #261 | Tragic 31.2% |
| Hmong | 0.3 /100 | #262 | Tragic 31.2% |
| Bahamians | 0.2 /100 | #263 | Tragic 31.3% |
| Immigrants | Ecuador | 0.2 /100 | #264 | Tragic 31.3% |
| German Russians | 0.2 /100 | #265 | Tragic 31.3% |
Demographics Similar to Greeks by Single Mother Poverty
In terms of single mother poverty, the demographic groups most similar to Greeks are Immigrants from Latvia (27.7%, a difference of 0.030%), Mongolian (27.7%, a difference of 0.040%), Immigrants from Cameroon (27.6%, a difference of 0.050%), Immigrants from Ukraine (27.7%, a difference of 0.13%), and Immigrants from Scotland (27.6%, a difference of 0.18%).
| Demographics | Rating | Rank | Single Mother Poverty |
| Peruvians | 99.2 /100 | #76 | Exceptional 27.5% |
| Immigrants | Peru | 99.2 /100 | #77 | Exceptional 27.5% |
| Immigrants | North Macedonia | 99.2 /100 | #78 | Exceptional 27.5% |
| Immigrants | Italy | 99.1 /100 | #79 | Exceptional 27.5% |
| Taiwanese | 99.1 /100 | #80 | Exceptional 27.5% |
| Immigrants | Scotland | 98.9 /100 | #81 | Exceptional 27.6% |
| Immigrants | Cameroon | 98.8 /100 | #82 | Exceptional 27.6% |
| Greeks | 98.7 /100 | #83 | Exceptional 27.7% |
| Immigrants | Latvia | 98.7 /100 | #84 | Exceptional 27.7% |
| Mongolians | 98.7 /100 | #85 | Exceptional 27.7% |
| Immigrants | Ukraine | 98.6 /100 | #86 | Exceptional 27.7% |
| Afghans | 98.5 /100 | #87 | Exceptional 27.7% |
| Ethiopians | 98.4 /100 | #88 | Exceptional 27.7% |
| Immigrants | Ethiopia | 98.4 /100 | #89 | Exceptional 27.7% |
| Immigrants | France | 98.2 /100 | #90 | Exceptional 27.8% |