Italian vs Greek Single Mother Poverty
COMPARE
Italian
Greek
Single Mother Poverty
Single Mother Poverty Comparison
Italians
Greeks
28.0%
SINGLE MOTHER POVERTY
96.6/ 100
METRIC RATING
104th/ 347
METRIC RANK
27.7%
SINGLE MOTHER POVERTY
98.7/ 100
METRIC RATING
83rd/ 347
METRIC RANK
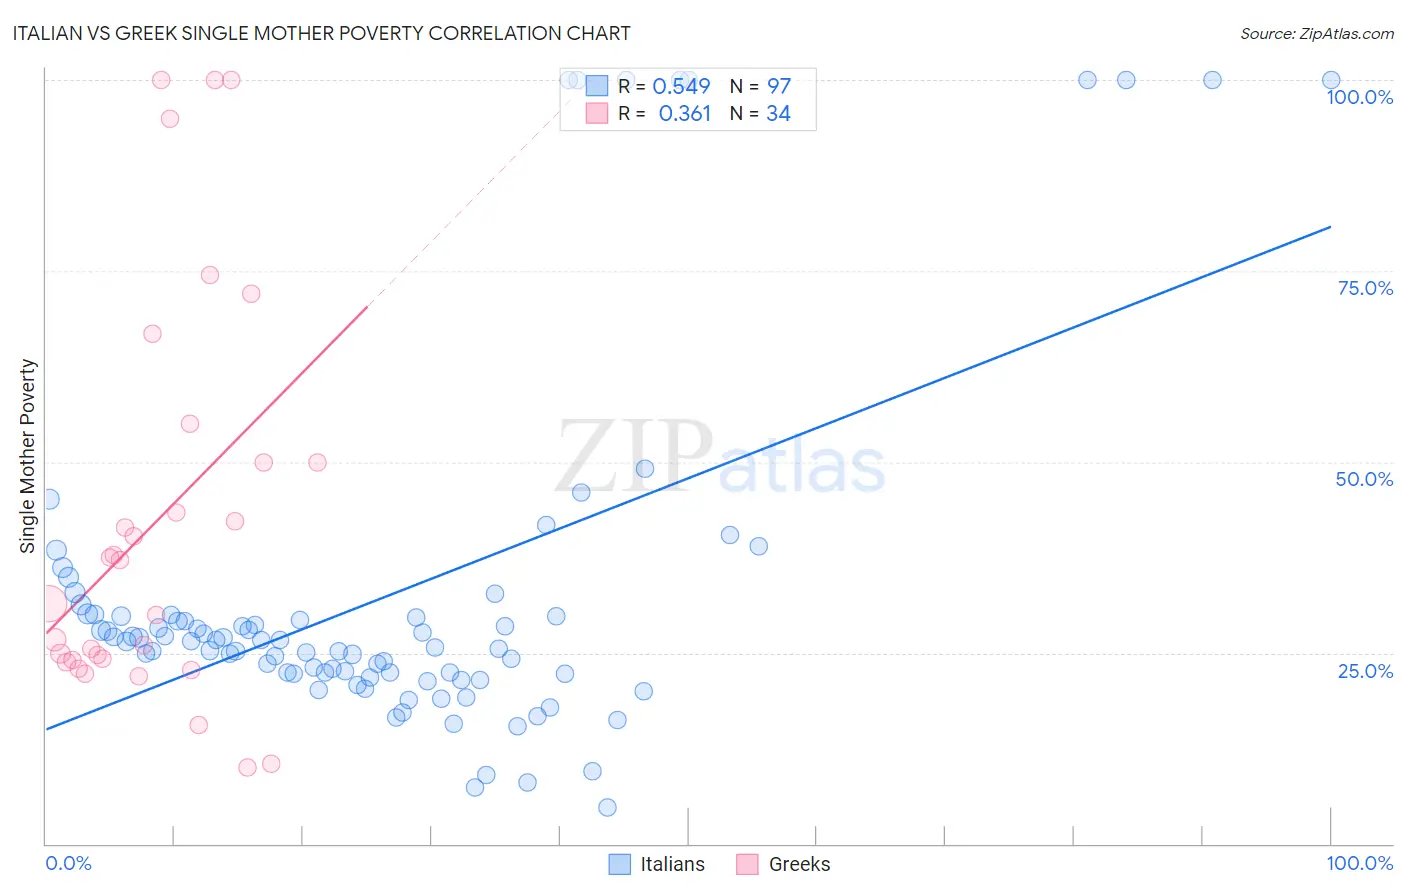
Italian vs Greek Single Mother Poverty Correlation Chart
The statistical analysis conducted on geographies consisting of 546,043,185 people shows a substantial positive correlation between the proportion of Italians and poverty level among single mothers in the United States with a correlation coefficient (R) of 0.549 and weighted average of 28.0%. Similarly, the statistical analysis conducted on geographies consisting of 465,143,502 people shows a mild positive correlation between the proportion of Greeks and poverty level among single mothers in the United States with a correlation coefficient (R) of 0.361 and weighted average of 27.7%, a difference of 1.3%.
Single Mother Poverty Correlation Summary
| Measurement | Italian | Greek |
| Minimum | 4.7% | 10.0% |
| Maximum | 100.0% | 100.0% |
| Range | 95.3% | 90.0% |
| Mean | 32.3% | 42.1% |
| Median | 26.6% | 34.3% |
| Interquartile 25% (IQ1) | 22.3% | 24.1% |
| Interquartile 75% (IQ3) | 29.9% | 50.0% |
| Interquartile Range (IQR) | 7.6% | 25.9% |
| Standard Deviation (Sample) | 23.0% | 26.2% |
| Standard Deviation (Population) | 22.9% | 25.8% |
Similar Demographics by Single Mother Poverty
Demographics Similar to Italians by Single Mother Poverty
In terms of single mother poverty, the demographic groups most similar to Italians are Immigrants from Northern Africa (28.0%, a difference of 0.020%), Israeli (28.0%, a difference of 0.020%), Immigrants from Croatia (28.0%, a difference of 0.030%), Ukrainian (28.0%, a difference of 0.070%), and Pakistani (28.0%, a difference of 0.14%).
| Demographics | Rating | Rank | Single Mother Poverty |
| Immigrants | Brazil | 97.2 /100 | #97 | Exceptional 27.9% |
| Immigrants | Nepal | 97.2 /100 | #98 | Exceptional 27.9% |
| Immigrants | Netherlands | 97.2 /100 | #99 | Exceptional 27.9% |
| Zimbabweans | 97.1 /100 | #100 | Exceptional 27.9% |
| Pakistanis | 96.9 /100 | #101 | Exceptional 28.0% |
| Immigrants | Croatia | 96.7 /100 | #102 | Exceptional 28.0% |
| Immigrants | Northern Africa | 96.6 /100 | #103 | Exceptional 28.0% |
| Italians | 96.6 /100 | #104 | Exceptional 28.0% |
| Israelis | 96.5 /100 | #105 | Exceptional 28.0% |
| Ukrainians | 96.4 /100 | #106 | Exceptional 28.0% |
| Immigrants | Venezuela | 95.8 /100 | #107 | Exceptional 28.1% |
| Immigrants | Zimbabwe | 95.5 /100 | #108 | Exceptional 28.1% |
| Immigrants | Armenia | 95.2 /100 | #109 | Exceptional 28.1% |
| Croatians | 94.8 /100 | #110 | Exceptional 28.2% |
| Venezuelans | 94.5 /100 | #111 | Exceptional 28.2% |
Demographics Similar to Greeks by Single Mother Poverty
In terms of single mother poverty, the demographic groups most similar to Greeks are Immigrants from Latvia (27.7%, a difference of 0.030%), Mongolian (27.7%, a difference of 0.040%), Immigrants from Cameroon (27.6%, a difference of 0.050%), Immigrants from Ukraine (27.7%, a difference of 0.13%), and Immigrants from Scotland (27.6%, a difference of 0.18%).
| Demographics | Rating | Rank | Single Mother Poverty |
| Peruvians | 99.2 /100 | #76 | Exceptional 27.5% |
| Immigrants | Peru | 99.2 /100 | #77 | Exceptional 27.5% |
| Immigrants | North Macedonia | 99.2 /100 | #78 | Exceptional 27.5% |
| Immigrants | Italy | 99.1 /100 | #79 | Exceptional 27.5% |
| Taiwanese | 99.1 /100 | #80 | Exceptional 27.5% |
| Immigrants | Scotland | 98.9 /100 | #81 | Exceptional 27.6% |
| Immigrants | Cameroon | 98.8 /100 | #82 | Exceptional 27.6% |
| Greeks | 98.7 /100 | #83 | Exceptional 27.7% |
| Immigrants | Latvia | 98.7 /100 | #84 | Exceptional 27.7% |
| Mongolians | 98.7 /100 | #85 | Exceptional 27.7% |
| Immigrants | Ukraine | 98.6 /100 | #86 | Exceptional 27.7% |
| Afghans | 98.5 /100 | #87 | Exceptional 27.7% |
| Ethiopians | 98.4 /100 | #88 | Exceptional 27.7% |
| Immigrants | Ethiopia | 98.4 /100 | #89 | Exceptional 27.7% |
| Immigrants | France | 98.2 /100 | #90 | Exceptional 27.8% |