Delaware vs Latvian Child Poverty Under the Age of 5
COMPARE
Delaware
Latvian
Child Poverty Under the Age of 5
Child Poverty Under the Age of 5 Comparison
Delaware
Latvians
18.7%
CHILD POVERTY UNDER THE AGE OF 5
3.4/ 100
METRIC RATING
218th/ 347
METRIC RANK
14.5%
CHILD POVERTY UNDER THE AGE OF 5
99.8/ 100
METRIC RATING
35th/ 347
METRIC RANK
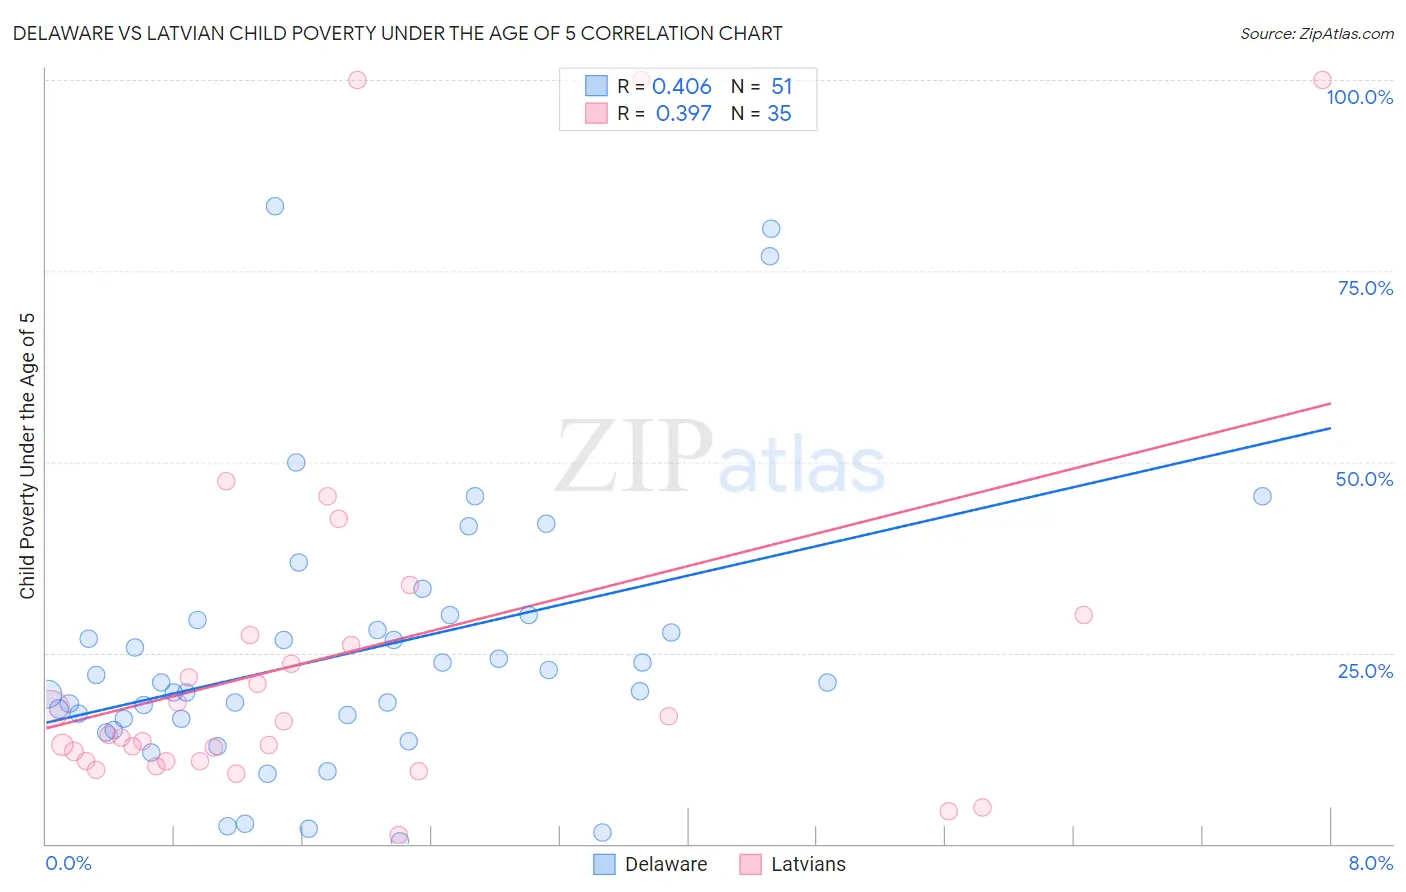
Delaware vs Latvian Child Poverty Under the Age of 5 Correlation Chart
The statistical analysis conducted on geographies consisting of 94,801,216 people shows a moderate positive correlation between the proportion of Delaware and poverty level among children under the age of 5 in the United States with a correlation coefficient (R) of 0.406 and weighted average of 18.7%. Similarly, the statistical analysis conducted on geographies consisting of 212,058,587 people shows a mild positive correlation between the proportion of Latvians and poverty level among children under the age of 5 in the United States with a correlation coefficient (R) of 0.397 and weighted average of 14.5%, a difference of 29.1%.
Child Poverty Under the Age of 5 Correlation Summary
| Measurement | Delaware | Latvian |
| Minimum | 0.41% | 1.2% |
| Maximum | 83.5% | 100.0% |
| Range | 83.1% | 98.8% |
| Mean | 25.0% | 25.0% |
| Median | 21.1% | 14.3% |
| Interquartile 25% (IQ1) | 16.3% | 10.8% |
| Interquartile 75% (IQ3) | 29.2% | 27.3% |
| Interquartile Range (IQR) | 12.9% | 16.5% |
| Standard Deviation (Sample) | 17.9% | 25.8% |
| Standard Deviation (Population) | 17.7% | 25.4% |
Similar Demographics by Child Poverty Under the Age of 5
Demographics Similar to Delaware by Child Poverty Under the Age of 5
In terms of child poverty under the age of 5, the demographic groups most similar to Delaware are German Russian (18.8%, a difference of 0.32%), Immigrants from the Azores (18.9%, a difference of 0.67%), Immigrants from Africa (18.6%, a difference of 0.75%), Hmong (18.5%, a difference of 0.95%), and Immigrants from Nigeria (19.0%, a difference of 1.2%).
| Demographics | Rating | Rank | Child Poverty Under the Age of 5 |
| Moroccans | 9.4 /100 | #211 | Tragic 18.2% |
| Nepalese | 8.7 /100 | #212 | Tragic 18.3% |
| Immigrants | Thailand | 8.6 /100 | #213 | Tragic 18.3% |
| Malaysians | 6.5 /100 | #214 | Tragic 18.4% |
| Immigrants | Panama | 6.0 /100 | #215 | Tragic 18.5% |
| Hmong | 5.0 /100 | #216 | Tragic 18.5% |
| Immigrants | Africa | 4.6 /100 | #217 | Tragic 18.6% |
| Delaware | 3.4 /100 | #218 | Tragic 18.7% |
| German Russians | 3.0 /100 | #219 | Tragic 18.8% |
| Immigrants | Azores | 2.6 /100 | #220 | Tragic 18.9% |
| Immigrants | Nigeria | 2.1 /100 | #221 | Tragic 19.0% |
| Alsatians | 1.7 /100 | #222 | Tragic 19.1% |
| Cubans | 1.7 /100 | #223 | Tragic 19.1% |
| Nicaraguans | 1.6 /100 | #224 | Tragic 19.1% |
| Nigerians | 1.6 /100 | #225 | Tragic 19.1% |
Demographics Similar to Latvians by Child Poverty Under the Age of 5
In terms of child poverty under the age of 5, the demographic groups most similar to Latvians are Immigrants from Moldova (14.5%, a difference of 0.010%), Maltese (14.5%, a difference of 0.070%), Taiwanese (14.5%, a difference of 0.11%), Immigrants from Sri Lanka (14.4%, a difference of 0.41%), and Turkish (14.6%, a difference of 0.41%).
| Demographics | Rating | Rank | Child Poverty Under the Age of 5 |
| Immigrants | Indonesia | 99.8 /100 | #28 | Exceptional 14.3% |
| Immigrants | Asia | 99.8 /100 | #29 | Exceptional 14.4% |
| Cambodians | 99.8 /100 | #30 | Exceptional 14.4% |
| Koreans | 99.8 /100 | #31 | Exceptional 14.4% |
| Immigrants | Sri Lanka | 99.8 /100 | #32 | Exceptional 14.4% |
| Taiwanese | 99.8 /100 | #33 | Exceptional 14.5% |
| Immigrants | Moldova | 99.8 /100 | #34 | Exceptional 14.5% |
| Latvians | 99.8 /100 | #35 | Exceptional 14.5% |
| Maltese | 99.8 /100 | #36 | Exceptional 14.5% |
| Turks | 99.7 /100 | #37 | Exceptional 14.6% |
| Eastern Europeans | 99.7 /100 | #38 | Exceptional 14.6% |
| Norwegians | 99.7 /100 | #39 | Exceptional 14.6% |
| Immigrants | Australia | 99.7 /100 | #40 | Exceptional 14.6% |
| Immigrants | Belarus | 99.7 /100 | #41 | Exceptional 14.7% |
| Soviet Union | 99.7 /100 | #42 | Exceptional 14.7% |