Alaskan Athabascan vs Latvian Child Poverty Under the Age of 5
COMPARE
Alaskan Athabascan
Latvian
Child Poverty Under the Age of 5
Child Poverty Under the Age of 5 Comparison
Alaskan Athabascans
Latvians
21.8%
CHILD POVERTY UNDER THE AGE OF 5
0.0/ 100
METRIC RATING
300th/ 347
METRIC RANK
14.5%
CHILD POVERTY UNDER THE AGE OF 5
99.8/ 100
METRIC RATING
35th/ 347
METRIC RANK
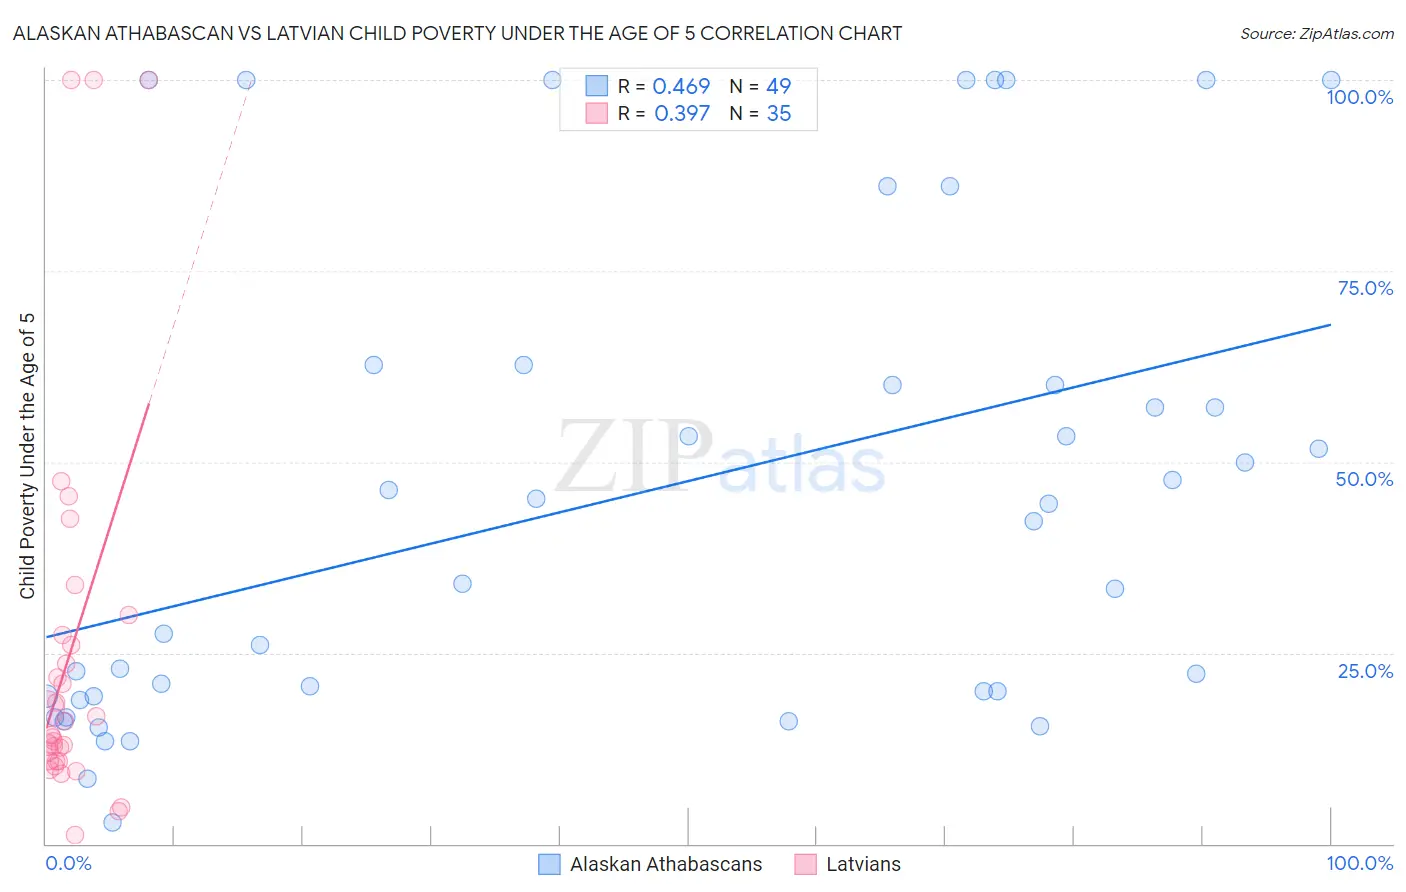
Alaskan Athabascan vs Latvian Child Poverty Under the Age of 5 Correlation Chart
The statistical analysis conducted on geographies consisting of 45,439,676 people shows a moderate positive correlation between the proportion of Alaskan Athabascans and poverty level among children under the age of 5 in the United States with a correlation coefficient (R) of 0.469 and weighted average of 21.8%. Similarly, the statistical analysis conducted on geographies consisting of 212,058,587 people shows a mild positive correlation between the proportion of Latvians and poverty level among children under the age of 5 in the United States with a correlation coefficient (R) of 0.397 and weighted average of 14.5%, a difference of 50.5%.
Child Poverty Under the Age of 5 Correlation Summary
| Measurement | Alaskan Athabascan | Latvian |
| Minimum | 2.7% | 1.2% |
| Maximum | 100.0% | 100.0% |
| Range | 97.3% | 98.8% |
| Mean | 45.5% | 25.0% |
| Median | 42.3% | 14.3% |
| Interquartile 25% (IQ1) | 19.3% | 10.8% |
| Interquartile 75% (IQ3) | 61.3% | 27.3% |
| Interquartile Range (IQR) | 42.0% | 16.5% |
| Standard Deviation (Sample) | 31.0% | 25.8% |
| Standard Deviation (Population) | 30.7% | 25.4% |
Similar Demographics by Child Poverty Under the Age of 5
Demographics Similar to Alaskan Athabascans by Child Poverty Under the Age of 5
In terms of child poverty under the age of 5, the demographic groups most similar to Alaskan Athabascans are Blackfeet (21.8%, a difference of 0.010%), Chickasaw (21.8%, a difference of 0.010%), Hispanic or Latino (21.7%, a difference of 0.40%), Yaqui (21.7%, a difference of 0.41%), and Cherokee (21.7%, a difference of 0.57%).
| Demographics | Rating | Rank | Child Poverty Under the Age of 5 |
| Mexicans | 0.0 /100 | #293 | Tragic 21.6% |
| Guatemalans | 0.0 /100 | #294 | Tragic 21.6% |
| Cherokee | 0.0 /100 | #295 | Tragic 21.7% |
| Yaqui | 0.0 /100 | #296 | Tragic 21.7% |
| Hispanics or Latinos | 0.0 /100 | #297 | Tragic 21.7% |
| Blackfeet | 0.0 /100 | #298 | Tragic 21.8% |
| Chickasaw | 0.0 /100 | #299 | Tragic 21.8% |
| Alaskan Athabascans | 0.0 /100 | #300 | Tragic 21.8% |
| Immigrants | Central America | 0.0 /100 | #301 | Tragic 22.0% |
| Iroquois | 0.0 /100 | #302 | Tragic 22.0% |
| Inupiat | 0.0 /100 | #303 | Tragic 22.0% |
| Immigrants | Guatemala | 0.0 /100 | #304 | Tragic 22.0% |
| Immigrants | Mexico | 0.0 /100 | #305 | Tragic 22.2% |
| Indonesians | 0.0 /100 | #306 | Tragic 22.3% |
| Immigrants | Bahamas | 0.0 /100 | #307 | Tragic 22.7% |
Demographics Similar to Latvians by Child Poverty Under the Age of 5
In terms of child poverty under the age of 5, the demographic groups most similar to Latvians are Immigrants from Moldova (14.5%, a difference of 0.010%), Maltese (14.5%, a difference of 0.070%), Taiwanese (14.5%, a difference of 0.11%), Immigrants from Sri Lanka (14.4%, a difference of 0.41%), and Turkish (14.6%, a difference of 0.41%).
| Demographics | Rating | Rank | Child Poverty Under the Age of 5 |
| Immigrants | Indonesia | 99.8 /100 | #28 | Exceptional 14.3% |
| Immigrants | Asia | 99.8 /100 | #29 | Exceptional 14.4% |
| Cambodians | 99.8 /100 | #30 | Exceptional 14.4% |
| Koreans | 99.8 /100 | #31 | Exceptional 14.4% |
| Immigrants | Sri Lanka | 99.8 /100 | #32 | Exceptional 14.4% |
| Taiwanese | 99.8 /100 | #33 | Exceptional 14.5% |
| Immigrants | Moldova | 99.8 /100 | #34 | Exceptional 14.5% |
| Latvians | 99.8 /100 | #35 | Exceptional 14.5% |
| Maltese | 99.8 /100 | #36 | Exceptional 14.5% |
| Turks | 99.7 /100 | #37 | Exceptional 14.6% |
| Eastern Europeans | 99.7 /100 | #38 | Exceptional 14.6% |
| Norwegians | 99.7 /100 | #39 | Exceptional 14.6% |
| Immigrants | Australia | 99.7 /100 | #40 | Exceptional 14.6% |
| Immigrants | Belarus | 99.7 /100 | #41 | Exceptional 14.7% |
| Soviet Union | 99.7 /100 | #42 | Exceptional 14.7% |