Delaware vs Latvian In Labor Force | Age 20-24
COMPARE
Delaware
Latvian
In Labor Force | Age 20-24
In Labor Force | Age 20-24 Comparison
Delaware
Latvians
75.5%
IN LABOR FORCE | AGE 20-24
84.5/ 100
METRIC RATING
140th/ 347
METRIC RANK
76.1%
IN LABOR FORCE | AGE 20-24
97.6/ 100
METRIC RATING
102nd/ 347
METRIC RANK
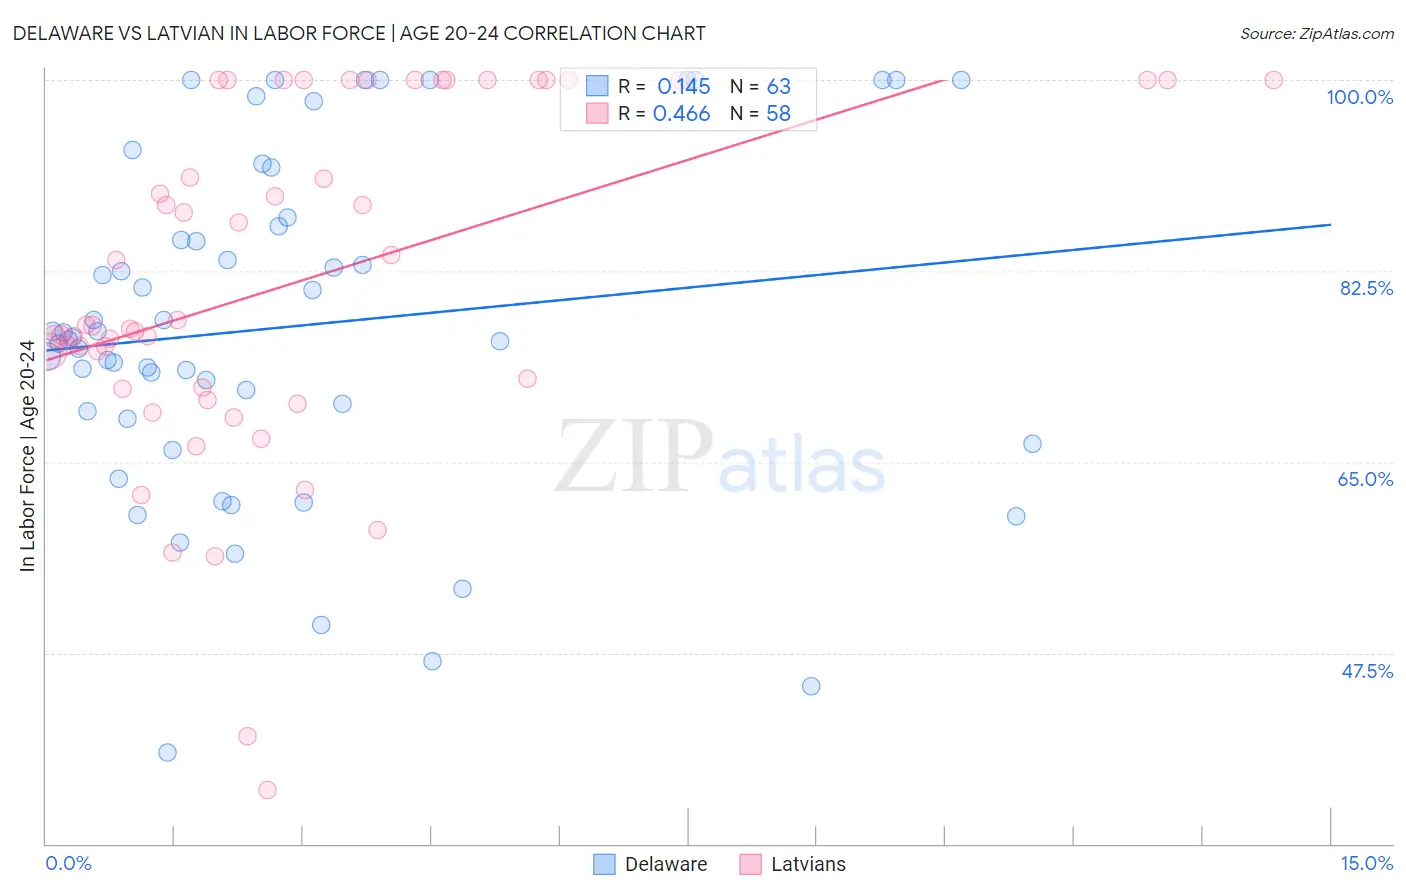
Delaware vs Latvian In Labor Force | Age 20-24 Correlation Chart
The statistical analysis conducted on geographies consisting of 96,225,060 people shows a poor positive correlation between the proportion of Delaware and labor force participation rate among population between the ages 20 and 24 in the United States with a correlation coefficient (R) of 0.145 and weighted average of 75.5%. Similarly, the statistical analysis conducted on geographies consisting of 220,651,647 people shows a moderate positive correlation between the proportion of Latvians and labor force participation rate among population between the ages 20 and 24 in the United States with a correlation coefficient (R) of 0.466 and weighted average of 76.1%, a difference of 0.74%.
In Labor Force | Age 20-24 Correlation Summary
| Measurement | Delaware | Latvian |
| Minimum | 38.4% | 34.9% |
| Maximum | 100.0% | 100.0% |
| Range | 61.6% | 65.1% |
| Mean | 77.4% | 81.5% |
| Median | 76.4% | 77.5% |
| Interquartile 25% (IQ1) | 69.0% | 71.8% |
| Interquartile 75% (IQ3) | 87.4% | 100.0% |
| Interquartile Range (IQR) | 18.4% | 28.2% |
| Standard Deviation (Sample) | 15.6% | 15.9% |
| Standard Deviation (Population) | 15.4% | 15.7% |
Similar Demographics by In Labor Force | Age 20-24
Demographics Similar to Delaware by In Labor Force | Age 20-24
In terms of in labor force | age 20-24, the demographic groups most similar to Delaware are Immigrants from England (75.5%, a difference of 0.0%), Immigrants from Brazil (75.5%, a difference of 0.010%), Jordanian (75.5%, a difference of 0.010%), Australian (75.5%, a difference of 0.010%), and Romanian (75.5%, a difference of 0.010%).
| Demographics | Rating | Rank | In Labor Force | Age 20-24 |
| Zimbabweans | 88.2 /100 | #133 | Excellent 75.6% |
| Estonians | 87.1 /100 | #134 | Excellent 75.6% |
| Yaqui | 85.5 /100 | #135 | Excellent 75.5% |
| Immigrants | Brazil | 84.8 /100 | #136 | Excellent 75.5% |
| Jordanians | 84.8 /100 | #137 | Excellent 75.5% |
| Australians | 84.8 /100 | #138 | Excellent 75.5% |
| Immigrants | England | 84.6 /100 | #139 | Excellent 75.5% |
| Delaware | 84.5 /100 | #140 | Excellent 75.5% |
| Romanians | 84.1 /100 | #141 | Excellent 75.5% |
| Blackfeet | 83.6 /100 | #142 | Excellent 75.5% |
| Spaniards | 82.0 /100 | #143 | Excellent 75.5% |
| Bhutanese | 80.8 /100 | #144 | Excellent 75.4% |
| Koreans | 79.7 /100 | #145 | Good 75.4% |
| Mexican American Indians | 78.8 /100 | #146 | Good 75.4% |
| Comanche | 77.6 /100 | #147 | Good 75.4% |
Demographics Similar to Latvians by In Labor Force | Age 20-24
In terms of in labor force | age 20-24, the demographic groups most similar to Latvians are Immigrants from Poland (76.1%, a difference of 0.010%), Shoshone (76.1%, a difference of 0.020%), Immigrants from North Macedonia (76.1%, a difference of 0.020%), American (76.1%, a difference of 0.030%), and Immigrants from Lithuania (76.1%, a difference of 0.060%).
| Demographics | Rating | Rank | In Labor Force | Age 20-24 |
| Immigrants | Germany | 98.5 /100 | #95 | Exceptional 76.2% |
| Immigrants | Nonimmigrants | 98.5 /100 | #96 | Exceptional 76.2% |
| Immigrants | Lithuania | 98.0 /100 | #97 | Exceptional 76.1% |
| Immigrants | Oceania | 98.0 /100 | #98 | Exceptional 76.1% |
| Americans | 97.8 /100 | #99 | Exceptional 76.1% |
| Shoshone | 97.8 /100 | #100 | Exceptional 76.1% |
| Immigrants | Poland | 97.7 /100 | #101 | Exceptional 76.1% |
| Latvians | 97.6 /100 | #102 | Exceptional 76.1% |
| Immigrants | North Macedonia | 97.5 /100 | #103 | Exceptional 76.1% |
| Macedonians | 97.2 /100 | #104 | Exceptional 76.0% |
| Immigrants | Nepal | 97.2 /100 | #105 | Exceptional 76.0% |
| Immigrants | Uganda | 97.1 /100 | #106 | Exceptional 76.0% |
| Greeks | 96.9 /100 | #107 | Exceptional 76.0% |
| Iraqis | 96.6 /100 | #108 | Exceptional 76.0% |
| Cherokee | 95.8 /100 | #109 | Exceptional 75.9% |