Delaware vs Immigrants from Iran Child Poverty Under the Age of 5
COMPARE
Delaware
Immigrants from Iran
Child Poverty Under the Age of 5
Child Poverty Under the Age of 5 Comparison
Delaware
Immigrants from Iran
18.7%
CHILD POVERTY UNDER THE AGE OF 5
3.4/ 100
METRIC RATING
218th/ 347
METRIC RANK
13.1%
CHILD POVERTY UNDER THE AGE OF 5
100.0/ 100
METRIC RATING
9th/ 347
METRIC RANK
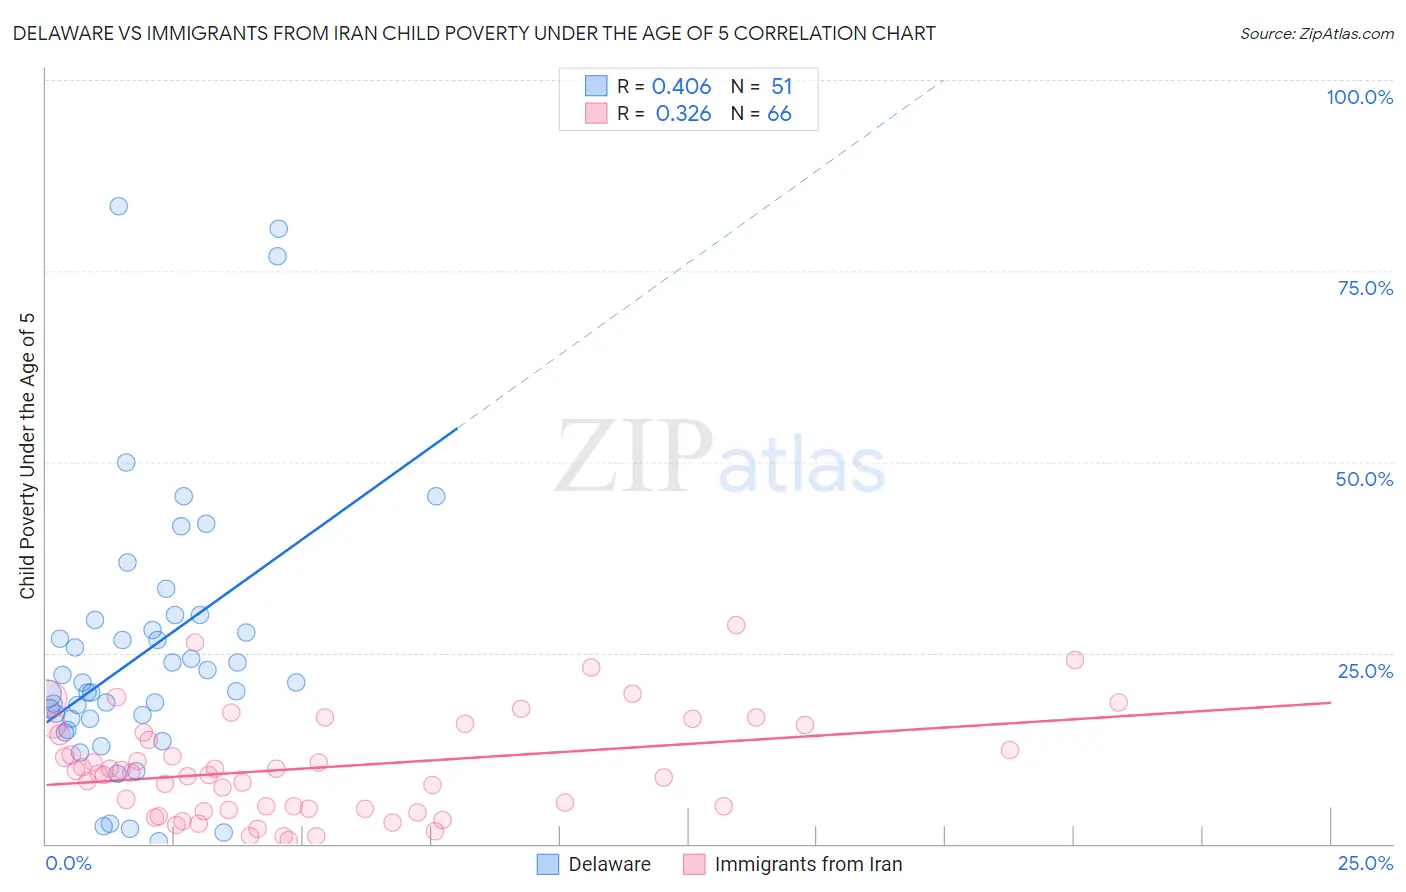
Delaware vs Immigrants from Iran Child Poverty Under the Age of 5 Correlation Chart
The statistical analysis conducted on geographies consisting of 94,801,216 people shows a moderate positive correlation between the proportion of Delaware and poverty level among children under the age of 5 in the United States with a correlation coefficient (R) of 0.406 and weighted average of 18.7%. Similarly, the statistical analysis conducted on geographies consisting of 269,372,648 people shows a mild positive correlation between the proportion of Immigrants from Iran and poverty level among children under the age of 5 in the United States with a correlation coefficient (R) of 0.326 and weighted average of 13.1%, a difference of 43.1%.
Child Poverty Under the Age of 5 Correlation Summary
| Measurement | Delaware | Immigrants from Iran |
| Minimum | 0.41% | 0.42% |
| Maximum | 83.5% | 28.6% |
| Range | 83.1% | 28.2% |
| Mean | 25.0% | 10.0% |
| Median | 21.1% | 9.3% |
| Interquartile 25% (IQ1) | 16.3% | 4.6% |
| Interquartile 75% (IQ3) | 29.2% | 14.6% |
| Interquartile Range (IQR) | 12.9% | 10.0% |
| Standard Deviation (Sample) | 17.9% | 6.6% |
| Standard Deviation (Population) | 17.7% | 6.5% |
Similar Demographics by Child Poverty Under the Age of 5
Demographics Similar to Delaware by Child Poverty Under the Age of 5
In terms of child poverty under the age of 5, the demographic groups most similar to Delaware are German Russian (18.8%, a difference of 0.32%), Immigrants from the Azores (18.9%, a difference of 0.67%), Immigrants from Africa (18.6%, a difference of 0.75%), Hmong (18.5%, a difference of 0.95%), and Immigrants from Nigeria (19.0%, a difference of 1.2%).
| Demographics | Rating | Rank | Child Poverty Under the Age of 5 |
| Moroccans | 9.4 /100 | #211 | Tragic 18.2% |
| Nepalese | 8.7 /100 | #212 | Tragic 18.3% |
| Immigrants | Thailand | 8.6 /100 | #213 | Tragic 18.3% |
| Malaysians | 6.5 /100 | #214 | Tragic 18.4% |
| Immigrants | Panama | 6.0 /100 | #215 | Tragic 18.5% |
| Hmong | 5.0 /100 | #216 | Tragic 18.5% |
| Immigrants | Africa | 4.6 /100 | #217 | Tragic 18.6% |
| Delaware | 3.4 /100 | #218 | Tragic 18.7% |
| German Russians | 3.0 /100 | #219 | Tragic 18.8% |
| Immigrants | Azores | 2.6 /100 | #220 | Tragic 18.9% |
| Immigrants | Nigeria | 2.1 /100 | #221 | Tragic 19.0% |
| Alsatians | 1.7 /100 | #222 | Tragic 19.1% |
| Cubans | 1.7 /100 | #223 | Tragic 19.1% |
| Nicaraguans | 1.6 /100 | #224 | Tragic 19.1% |
| Nigerians | 1.6 /100 | #225 | Tragic 19.1% |
Demographics Similar to Immigrants from Iran by Child Poverty Under the Age of 5
In terms of child poverty under the age of 5, the demographic groups most similar to Immigrants from Iran are Iranian (13.1%, a difference of 0.16%), Chinese (13.1%, a difference of 0.17%), Burmese (13.2%, a difference of 1.1%), Immigrants from Singapore (12.9%, a difference of 1.2%), and Immigrants from Korea (13.2%, a difference of 1.2%).
| Demographics | Rating | Rank | Child Poverty Under the Age of 5 |
| Immigrants | Taiwan | 100.0 /100 | #2 | Exceptional 11.6% |
| Filipinos | 100.0 /100 | #3 | Exceptional 11.6% |
| Thais | 100.0 /100 | #4 | Exceptional 12.3% |
| Immigrants | Hong Kong | 100.0 /100 | #5 | Exceptional 12.4% |
| Immigrants | Singapore | 100.0 /100 | #6 | Exceptional 12.9% |
| Chinese | 100.0 /100 | #7 | Exceptional 13.1% |
| Iranians | 100.0 /100 | #8 | Exceptional 13.1% |
| Immigrants | Iran | 100.0 /100 | #9 | Exceptional 13.1% |
| Burmese | 100.0 /100 | #10 | Exceptional 13.2% |
| Immigrants | Korea | 100.0 /100 | #11 | Exceptional 13.2% |
| Immigrants | South Central Asia | 100.0 /100 | #12 | Exceptional 13.3% |
| Bhutanese | 100.0 /100 | #13 | Exceptional 13.4% |
| Okinawans | 100.0 /100 | #14 | Exceptional 13.4% |
| Indians (Asian) | 100.0 /100 | #15 | Exceptional 13.4% |
| Immigrants | Eastern Asia | 100.0 /100 | #16 | Exceptional 13.5% |