Delaware vs European Child Poverty Under the Age of 5
COMPARE
Delaware
European
Child Poverty Under the Age of 5
Child Poverty Under the Age of 5 Comparison
Delaware
Europeans
18.7%
CHILD POVERTY UNDER THE AGE OF 5
3.4/ 100
METRIC RATING
218th/ 347
METRIC RANK
15.9%
CHILD POVERTY UNDER THE AGE OF 5
95.3/ 100
METRIC RATING
103rd/ 347
METRIC RANK
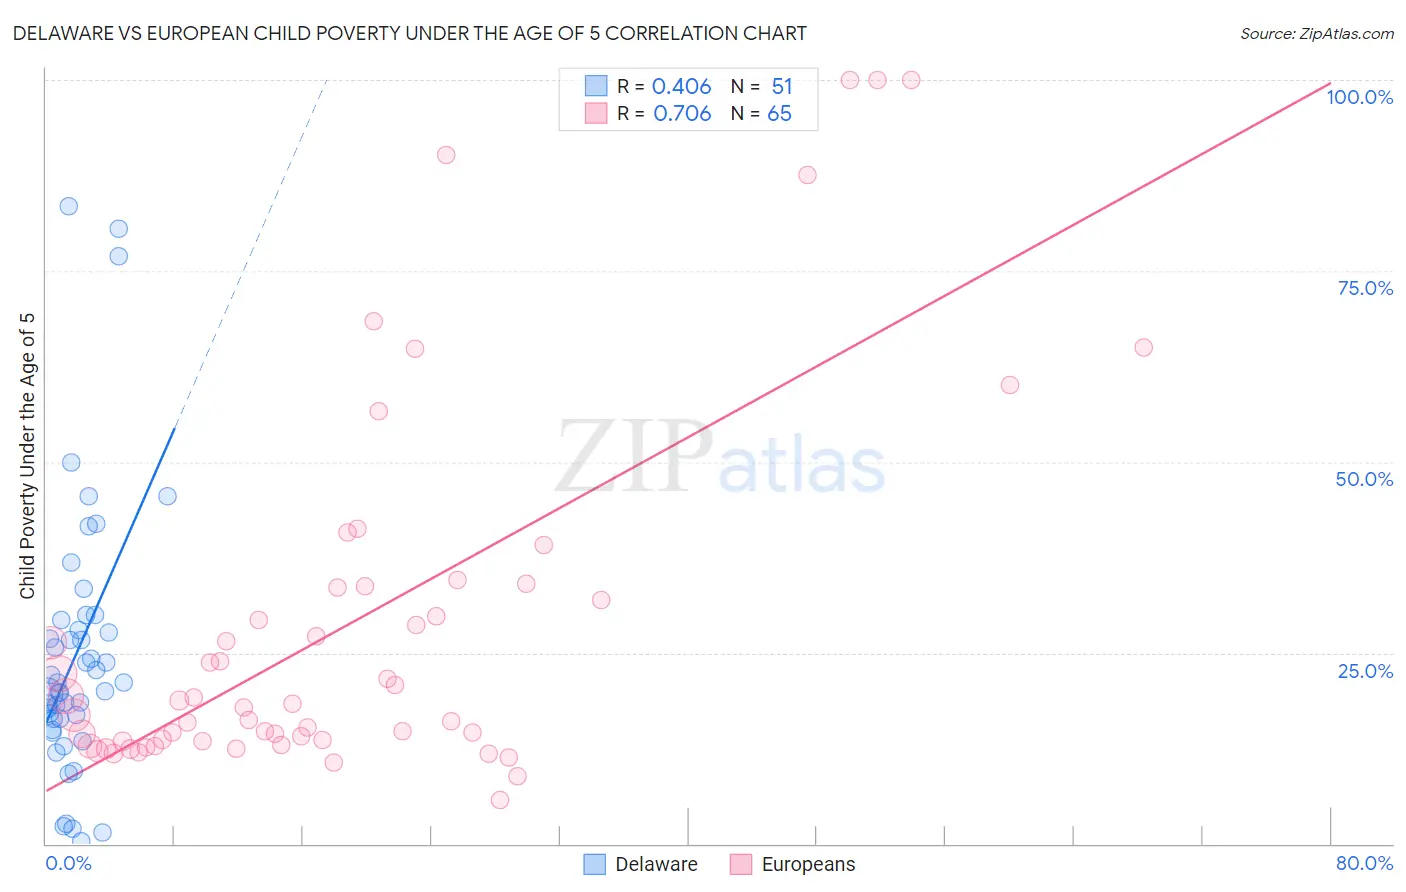
Delaware vs European Child Poverty Under the Age of 5 Correlation Chart
The statistical analysis conducted on geographies consisting of 94,801,216 people shows a moderate positive correlation between the proportion of Delaware and poverty level among children under the age of 5 in the United States with a correlation coefficient (R) of 0.406 and weighted average of 18.7%. Similarly, the statistical analysis conducted on geographies consisting of 523,525,601 people shows a strong positive correlation between the proportion of Europeans and poverty level among children under the age of 5 in the United States with a correlation coefficient (R) of 0.706 and weighted average of 15.9%, a difference of 17.8%.
Child Poverty Under the Age of 5 Correlation Summary
| Measurement | Delaware | European |
| Minimum | 0.41% | 5.7% |
| Maximum | 83.5% | 100.0% |
| Range | 83.1% | 94.3% |
| Mean | 25.0% | 28.7% |
| Median | 21.1% | 18.3% |
| Interquartile 25% (IQ1) | 16.3% | 13.5% |
| Interquartile 75% (IQ3) | 29.2% | 33.6% |
| Interquartile Range (IQR) | 12.9% | 20.1% |
| Standard Deviation (Sample) | 17.9% | 24.2% |
| Standard Deviation (Population) | 17.7% | 24.0% |
Similar Demographics by Child Poverty Under the Age of 5
Demographics Similar to Delaware by Child Poverty Under the Age of 5
In terms of child poverty under the age of 5, the demographic groups most similar to Delaware are German Russian (18.8%, a difference of 0.32%), Immigrants from the Azores (18.9%, a difference of 0.67%), Immigrants from Africa (18.6%, a difference of 0.75%), Hmong (18.5%, a difference of 0.95%), and Immigrants from Nigeria (19.0%, a difference of 1.2%).
| Demographics | Rating | Rank | Child Poverty Under the Age of 5 |
| Moroccans | 9.4 /100 | #211 | Tragic 18.2% |
| Nepalese | 8.7 /100 | #212 | Tragic 18.3% |
| Immigrants | Thailand | 8.6 /100 | #213 | Tragic 18.3% |
| Malaysians | 6.5 /100 | #214 | Tragic 18.4% |
| Immigrants | Panama | 6.0 /100 | #215 | Tragic 18.5% |
| Hmong | 5.0 /100 | #216 | Tragic 18.5% |
| Immigrants | Africa | 4.6 /100 | #217 | Tragic 18.6% |
| Delaware | 3.4 /100 | #218 | Tragic 18.7% |
| German Russians | 3.0 /100 | #219 | Tragic 18.8% |
| Immigrants | Azores | 2.6 /100 | #220 | Tragic 18.9% |
| Immigrants | Nigeria | 2.1 /100 | #221 | Tragic 19.0% |
| Alsatians | 1.7 /100 | #222 | Tragic 19.1% |
| Cubans | 1.7 /100 | #223 | Tragic 19.1% |
| Nicaraguans | 1.6 /100 | #224 | Tragic 19.1% |
| Nigerians | 1.6 /100 | #225 | Tragic 19.1% |
Demographics Similar to Europeans by Child Poverty Under the Age of 5
In terms of child poverty under the age of 5, the demographic groups most similar to Europeans are Immigrants from North America (15.9%, a difference of 0.21%), Armenian (15.8%, a difference of 0.28%), Immigrants from Spain (15.9%, a difference of 0.28%), Tlingit-Haida (15.9%, a difference of 0.33%), and Immigrants from Zimbabwe (15.8%, a difference of 0.41%).
| Demographics | Rating | Rank | Child Poverty Under the Age of 5 |
| Immigrants | Kazakhstan | 96.2 /100 | #96 | Exceptional 15.8% |
| Macedonians | 96.2 /100 | #97 | Exceptional 15.8% |
| Immigrants | South Africa | 96.1 /100 | #98 | Exceptional 15.8% |
| Palestinians | 95.9 /100 | #99 | Exceptional 15.8% |
| Immigrants | Canada | 95.9 /100 | #100 | Exceptional 15.8% |
| Immigrants | Zimbabwe | 95.9 /100 | #101 | Exceptional 15.8% |
| Armenians | 95.7 /100 | #102 | Exceptional 15.8% |
| Europeans | 95.3 /100 | #103 | Exceptional 15.9% |
| Immigrants | North America | 94.9 /100 | #104 | Exceptional 15.9% |
| Immigrants | Spain | 94.8 /100 | #105 | Exceptional 15.9% |
| Tlingit-Haida | 94.7 /100 | #106 | Exceptional 15.9% |
| Slovenes | 94.4 /100 | #107 | Exceptional 16.0% |
| Immigrants | Brazil | 94.4 /100 | #108 | Exceptional 16.0% |
| Northern Europeans | 94.3 /100 | #109 | Exceptional 16.0% |
| Romanians | 94.3 /100 | #110 | Exceptional 16.0% |