Immigrants from Liberia vs Latvian Child Poverty Under the Age of 5
COMPARE
Immigrants from Liberia
Latvian
Child Poverty Under the Age of 5
Child Poverty Under the Age of 5 Comparison
Immigrants from Liberia
Latvians
20.2%
CHILD POVERTY UNDER THE AGE OF 5
0.1/ 100
METRIC RATING
264th/ 347
METRIC RANK
14.5%
CHILD POVERTY UNDER THE AGE OF 5
99.8/ 100
METRIC RATING
35th/ 347
METRIC RANK
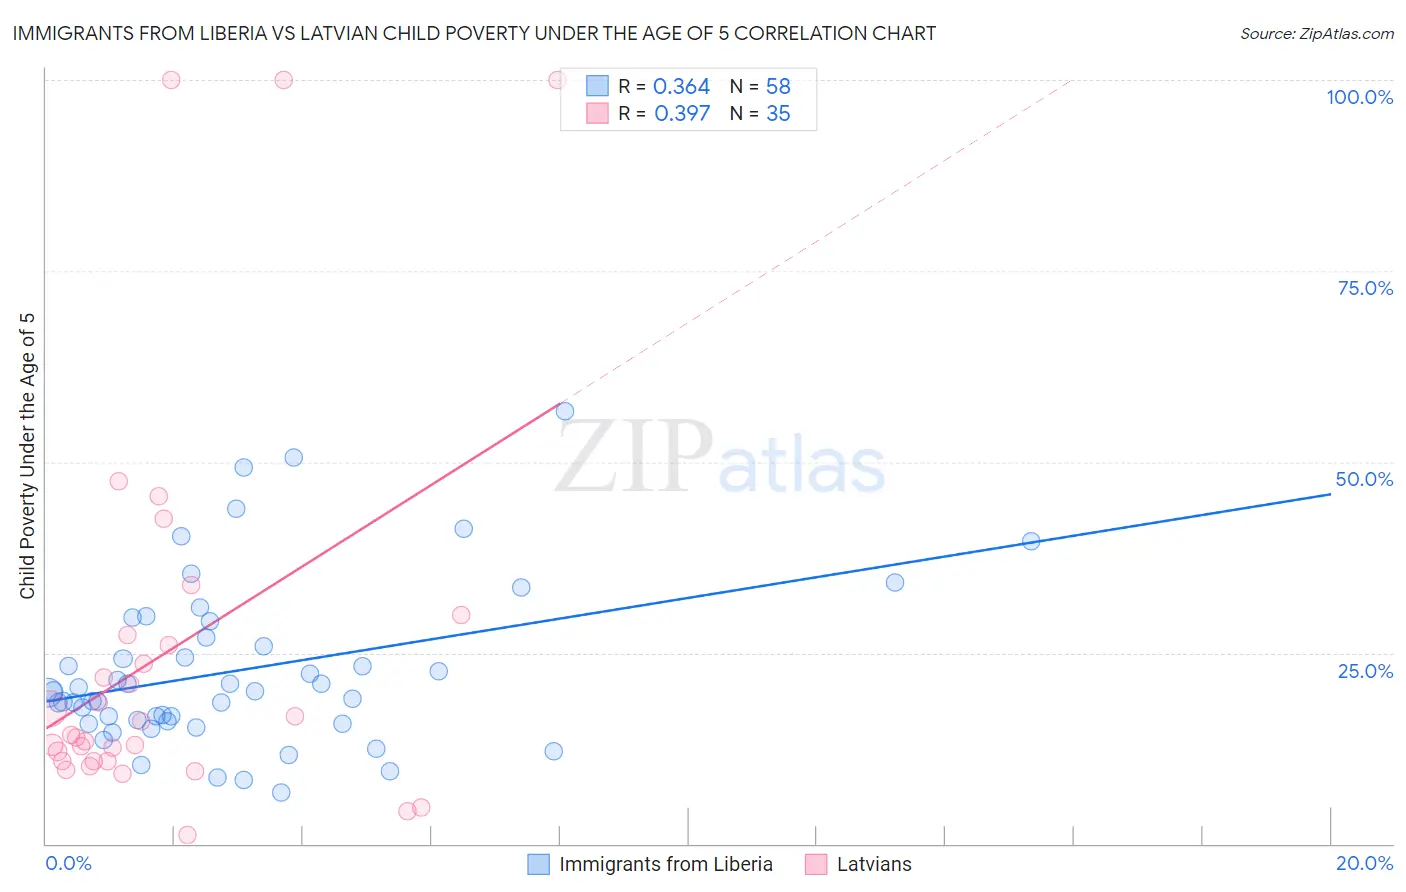
Immigrants from Liberia vs Latvian Child Poverty Under the Age of 5 Correlation Chart
The statistical analysis conducted on geographies consisting of 133,700,788 people shows a mild positive correlation between the proportion of Immigrants from Liberia and poverty level among children under the age of 5 in the United States with a correlation coefficient (R) of 0.364 and weighted average of 20.2%. Similarly, the statistical analysis conducted on geographies consisting of 212,058,587 people shows a mild positive correlation between the proportion of Latvians and poverty level among children under the age of 5 in the United States with a correlation coefficient (R) of 0.397 and weighted average of 14.5%, a difference of 39.4%.
Child Poverty Under the Age of 5 Correlation Summary
| Measurement | Immigrants from Liberia | Latvian |
| Minimum | 6.7% | 1.2% |
| Maximum | 56.7% | 100.0% |
| Range | 50.0% | 98.8% |
| Mean | 22.7% | 25.0% |
| Median | 19.9% | 14.3% |
| Interquartile 25% (IQ1) | 16.1% | 10.8% |
| Interquartile 75% (IQ3) | 27.0% | 27.3% |
| Interquartile Range (IQR) | 11.0% | 16.5% |
| Standard Deviation (Sample) | 10.9% | 25.8% |
| Standard Deviation (Population) | 10.8% | 25.4% |
Similar Demographics by Child Poverty Under the Age of 5
Demographics Similar to Immigrants from Liberia by Child Poverty Under the Age of 5
In terms of child poverty under the age of 5, the demographic groups most similar to Immigrants from Liberia are Barbadian (20.2%, a difference of 0.12%), Spanish American Indian (20.2%, a difference of 0.12%), Liberian (20.2%, a difference of 0.19%), Aleut (20.3%, a difference of 0.24%), and Immigrants from Bangladesh (20.1%, a difference of 0.60%).
| Demographics | Rating | Rank | Child Poverty Under the Age of 5 |
| Shoshone | 0.2 /100 | #257 | Tragic 20.0% |
| Immigrants | St. Vincent and the Grenadines | 0.2 /100 | #258 | Tragic 20.0% |
| Immigrants | El Salvador | 0.2 /100 | #259 | Tragic 20.0% |
| Spanish Americans | 0.2 /100 | #260 | Tragic 20.1% |
| Immigrants | Bangladesh | 0.2 /100 | #261 | Tragic 20.1% |
| Liberians | 0.1 /100 | #262 | Tragic 20.2% |
| Barbadians | 0.1 /100 | #263 | Tragic 20.2% |
| Immigrants | Liberia | 0.1 /100 | #264 | Tragic 20.2% |
| Spanish American Indians | 0.1 /100 | #265 | Tragic 20.2% |
| Aleuts | 0.1 /100 | #266 | Tragic 20.3% |
| Ottawa | 0.1 /100 | #267 | Tragic 20.3% |
| Belizeans | 0.1 /100 | #268 | Tragic 20.3% |
| Immigrants | Burma/Myanmar | 0.1 /100 | #269 | Tragic 20.4% |
| Jamaicans | 0.1 /100 | #270 | Tragic 20.4% |
| Americans | 0.1 /100 | #271 | Tragic 20.5% |
Demographics Similar to Latvians by Child Poverty Under the Age of 5
In terms of child poverty under the age of 5, the demographic groups most similar to Latvians are Immigrants from Moldova (14.5%, a difference of 0.010%), Maltese (14.5%, a difference of 0.070%), Taiwanese (14.5%, a difference of 0.11%), Immigrants from Sri Lanka (14.4%, a difference of 0.41%), and Turkish (14.6%, a difference of 0.41%).
| Demographics | Rating | Rank | Child Poverty Under the Age of 5 |
| Immigrants | Indonesia | 99.8 /100 | #28 | Exceptional 14.3% |
| Immigrants | Asia | 99.8 /100 | #29 | Exceptional 14.4% |
| Cambodians | 99.8 /100 | #30 | Exceptional 14.4% |
| Koreans | 99.8 /100 | #31 | Exceptional 14.4% |
| Immigrants | Sri Lanka | 99.8 /100 | #32 | Exceptional 14.4% |
| Taiwanese | 99.8 /100 | #33 | Exceptional 14.5% |
| Immigrants | Moldova | 99.8 /100 | #34 | Exceptional 14.5% |
| Latvians | 99.8 /100 | #35 | Exceptional 14.5% |
| Maltese | 99.8 /100 | #36 | Exceptional 14.5% |
| Turks | 99.7 /100 | #37 | Exceptional 14.6% |
| Eastern Europeans | 99.7 /100 | #38 | Exceptional 14.6% |
| Norwegians | 99.7 /100 | #39 | Exceptional 14.6% |
| Immigrants | Australia | 99.7 /100 | #40 | Exceptional 14.6% |
| Immigrants | Belarus | 99.7 /100 | #41 | Exceptional 14.7% |
| Soviet Union | 99.7 /100 | #42 | Exceptional 14.7% |