Delaware vs Immigrants from Bosnia and Herzegovina Child Poverty Under the Age of 5
COMPARE
Delaware
Immigrants from Bosnia and Herzegovina
Child Poverty Under the Age of 5
Child Poverty Under the Age of 5 Comparison
Delaware
Immigrants from Bosnia and Herzegovina
18.7%
CHILD POVERTY UNDER THE AGE OF 5
3.4/ 100
METRIC RATING
218th/ 347
METRIC RANK
17.5%
CHILD POVERTY UNDER THE AGE OF 5
35.0/ 100
METRIC RATING
186th/ 347
METRIC RANK
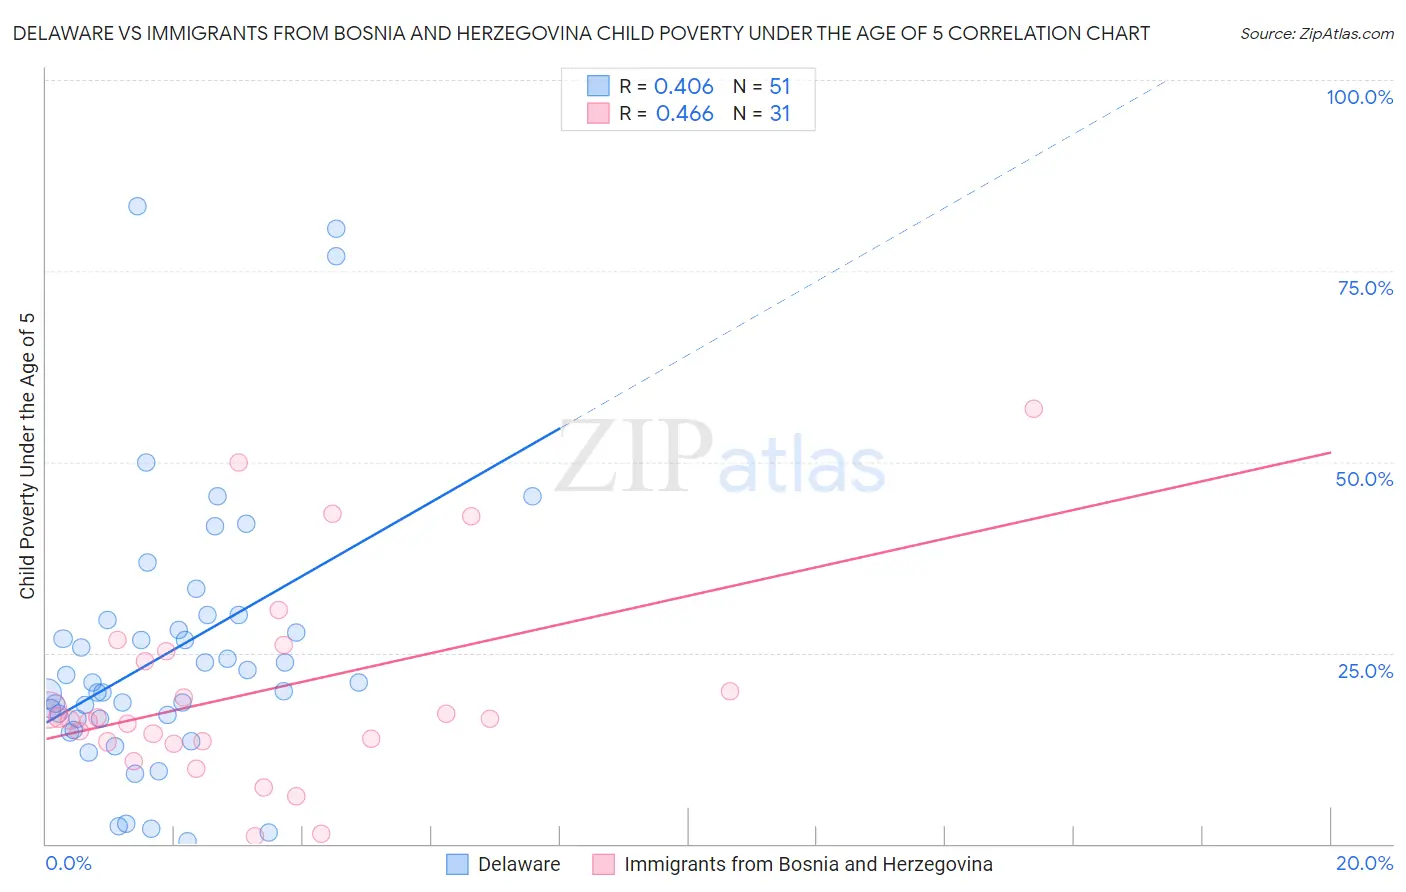
Delaware vs Immigrants from Bosnia and Herzegovina Child Poverty Under the Age of 5 Correlation Chart
The statistical analysis conducted on geographies consisting of 94,801,216 people shows a moderate positive correlation between the proportion of Delaware and poverty level among children under the age of 5 in the United States with a correlation coefficient (R) of 0.406 and weighted average of 18.7%. Similarly, the statistical analysis conducted on geographies consisting of 153,805,679 people shows a moderate positive correlation between the proportion of Immigrants from Bosnia and Herzegovina and poverty level among children under the age of 5 in the United States with a correlation coefficient (R) of 0.466 and weighted average of 17.5%, a difference of 6.9%.
Child Poverty Under the Age of 5 Correlation Summary
| Measurement | Delaware | Immigrants from Bosnia and Herzegovina |
| Minimum | 0.41% | 1.0% |
| Maximum | 83.5% | 57.0% |
| Range | 83.1% | 56.0% |
| Mean | 25.0% | 19.9% |
| Median | 21.1% | 16.4% |
| Interquartile 25% (IQ1) | 16.3% | 13.3% |
| Interquartile 75% (IQ3) | 29.2% | 25.2% |
| Interquartile Range (IQR) | 12.9% | 11.9% |
| Standard Deviation (Sample) | 17.9% | 13.1% |
| Standard Deviation (Population) | 17.7% | 12.9% |
Similar Demographics by Child Poverty Under the Age of 5
Demographics Similar to Delaware by Child Poverty Under the Age of 5
In terms of child poverty under the age of 5, the demographic groups most similar to Delaware are German Russian (18.8%, a difference of 0.32%), Immigrants from the Azores (18.9%, a difference of 0.67%), Immigrants from Africa (18.6%, a difference of 0.75%), Hmong (18.5%, a difference of 0.95%), and Immigrants from Nigeria (19.0%, a difference of 1.2%).
| Demographics | Rating | Rank | Child Poverty Under the Age of 5 |
| Moroccans | 9.4 /100 | #211 | Tragic 18.2% |
| Nepalese | 8.7 /100 | #212 | Tragic 18.3% |
| Immigrants | Thailand | 8.6 /100 | #213 | Tragic 18.3% |
| Malaysians | 6.5 /100 | #214 | Tragic 18.4% |
| Immigrants | Panama | 6.0 /100 | #215 | Tragic 18.5% |
| Hmong | 5.0 /100 | #216 | Tragic 18.5% |
| Immigrants | Africa | 4.6 /100 | #217 | Tragic 18.6% |
| Delaware | 3.4 /100 | #218 | Tragic 18.7% |
| German Russians | 3.0 /100 | #219 | Tragic 18.8% |
| Immigrants | Azores | 2.6 /100 | #220 | Tragic 18.9% |
| Immigrants | Nigeria | 2.1 /100 | #221 | Tragic 19.0% |
| Alsatians | 1.7 /100 | #222 | Tragic 19.1% |
| Cubans | 1.7 /100 | #223 | Tragic 19.1% |
| Nicaraguans | 1.6 /100 | #224 | Tragic 19.1% |
| Nigerians | 1.6 /100 | #225 | Tragic 19.1% |
Demographics Similar to Immigrants from Bosnia and Herzegovina by Child Poverty Under the Age of 5
In terms of child poverty under the age of 5, the demographic groups most similar to Immigrants from Bosnia and Herzegovina are Kenyan (17.5%, a difference of 0.040%), Carpatho Rusyn (17.5%, a difference of 0.16%), French (17.5%, a difference of 0.16%), Immigrants from Armenia (17.5%, a difference of 0.33%), and Immigrants from Costa Rica (17.4%, a difference of 0.45%).
| Demographics | Rating | Rank | Child Poverty Under the Age of 5 |
| Hawaiians | 41.5 /100 | #179 | Average 17.4% |
| South American Indians | 41.4 /100 | #180 | Average 17.4% |
| Immigrants | Germany | 41.0 /100 | #181 | Average 17.4% |
| Arabs | 40.7 /100 | #182 | Average 17.4% |
| Lebanese | 40.3 /100 | #183 | Average 17.4% |
| Immigrants | Costa Rica | 39.0 /100 | #184 | Fair 17.4% |
| Immigrants | Armenia | 38.0 /100 | #185 | Fair 17.5% |
| Immigrants | Bosnia and Herzegovina | 35.0 /100 | #186 | Fair 17.5% |
| Kenyans | 34.7 /100 | #187 | Fair 17.5% |
| Carpatho Rusyns | 33.6 /100 | #188 | Fair 17.5% |
| French | 33.6 /100 | #189 | Fair 17.5% |
| Slovaks | 29.2 /100 | #190 | Fair 17.6% |
| Immigrants | Afghanistan | 27.9 /100 | #191 | Fair 17.7% |
| Immigrants | Uruguay | 27.8 /100 | #192 | Fair 17.7% |
| Immigrants | Uganda | 25.0 /100 | #193 | Fair 17.7% |