Hopi vs Latvian Child Poverty Under the Age of 5
COMPARE
Hopi
Latvian
Child Poverty Under the Age of 5
Child Poverty Under the Age of 5 Comparison
Hopi
Latvians
27.7%
CHILD POVERTY UNDER THE AGE OF 5
0.0/ 100
METRIC RATING
338th/ 347
METRIC RANK
14.5%
CHILD POVERTY UNDER THE AGE OF 5
99.8/ 100
METRIC RATING
35th/ 347
METRIC RANK
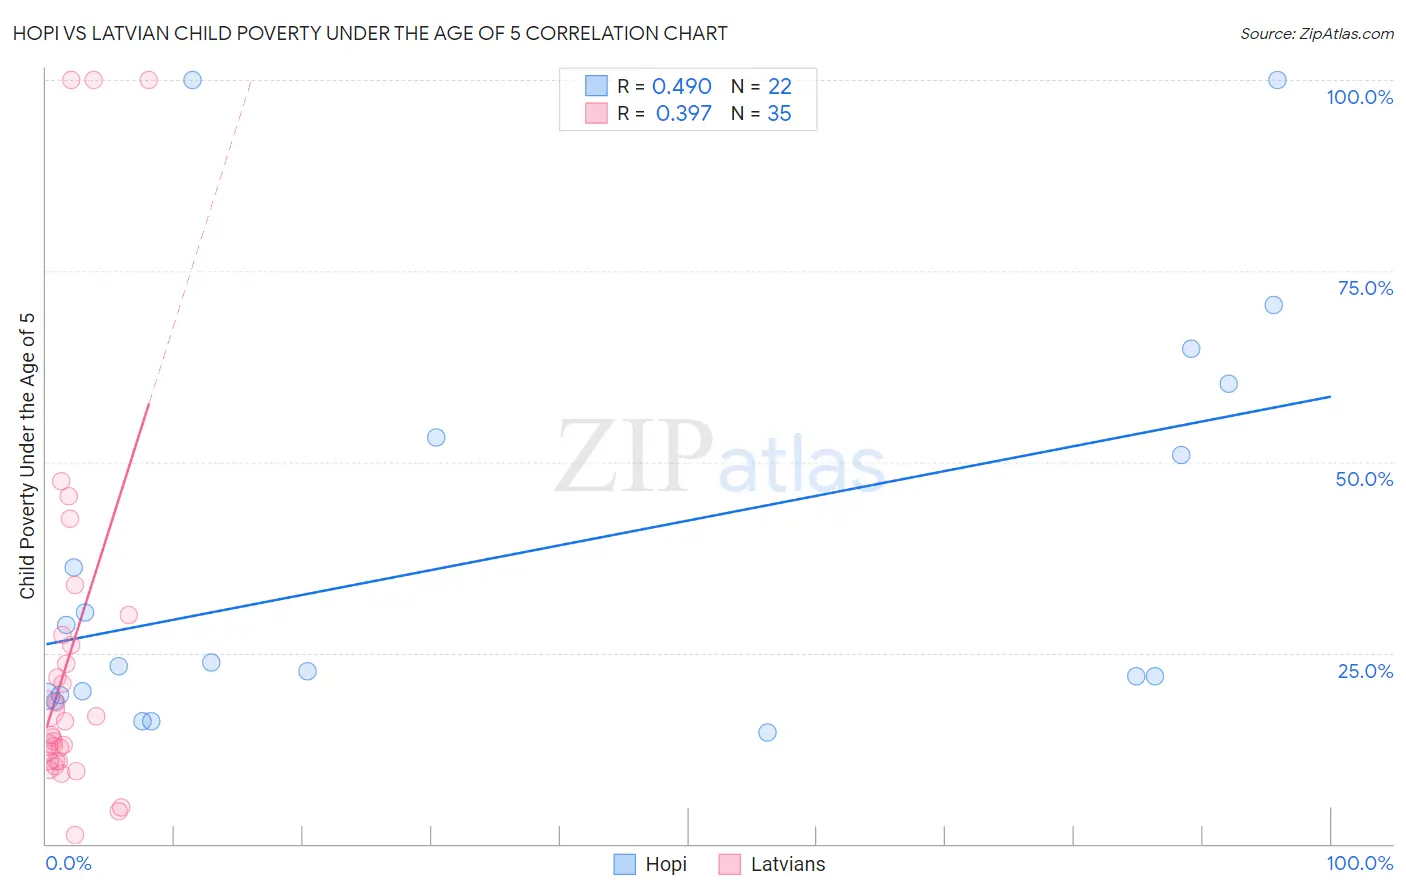
Hopi vs Latvian Child Poverty Under the Age of 5 Correlation Chart
The statistical analysis conducted on geographies consisting of 74,298,167 people shows a moderate positive correlation between the proportion of Hopi and poverty level among children under the age of 5 in the United States with a correlation coefficient (R) of 0.490 and weighted average of 27.7%. Similarly, the statistical analysis conducted on geographies consisting of 212,058,587 people shows a mild positive correlation between the proportion of Latvians and poverty level among children under the age of 5 in the United States with a correlation coefficient (R) of 0.397 and weighted average of 14.5%, a difference of 91.1%.
Child Poverty Under the Age of 5 Correlation Summary
| Measurement | Hopi | Latvian |
| Minimum | 14.6% | 1.2% |
| Maximum | 100.0% | 100.0% |
| Range | 85.4% | 98.8% |
| Mean | 37.8% | 25.0% |
| Median | 23.5% | 14.3% |
| Interquartile 25% (IQ1) | 19.5% | 10.8% |
| Interquartile 75% (IQ3) | 53.1% | 27.3% |
| Interquartile Range (IQR) | 33.6% | 16.5% |
| Standard Deviation (Sample) | 26.4% | 25.8% |
| Standard Deviation (Population) | 25.7% | 25.4% |
Similar Demographics by Child Poverty Under the Age of 5
Demographics Similar to Hopi by Child Poverty Under the Age of 5
In terms of child poverty under the age of 5, the demographic groups most similar to Hopi are Yup'ik (27.7%, a difference of 0.070%), Pima (27.4%, a difference of 1.0%), Cheyenne (28.3%, a difference of 2.3%), Sioux (26.9%, a difference of 2.9%), and Immigrants from Yemen (29.3%, a difference of 5.7%).
| Demographics | Rating | Rank | Child Poverty Under the Age of 5 |
| Kiowa | 0.0 /100 | #331 | Tragic 24.5% |
| Apache | 0.0 /100 | #332 | Tragic 25.0% |
| Natives/Alaskans | 0.0 /100 | #333 | Tragic 25.6% |
| Blacks/African Americans | 0.0 /100 | #334 | Tragic 25.7% |
| Colville | 0.0 /100 | #335 | Tragic 25.7% |
| Sioux | 0.0 /100 | #336 | Tragic 26.9% |
| Pima | 0.0 /100 | #337 | Tragic 27.4% |
| Hopi | 0.0 /100 | #338 | Tragic 27.7% |
| Yup'ik | 0.0 /100 | #339 | Tragic 27.7% |
| Cheyenne | 0.0 /100 | #340 | Tragic 28.3% |
| Immigrants | Yemen | 0.0 /100 | #341 | Tragic 29.3% |
| Tohono O'odham | 0.0 /100 | #342 | Tragic 29.5% |
| Yuman | 0.0 /100 | #343 | Tragic 29.5% |
| Crow | 0.0 /100 | #344 | Tragic 31.0% |
| Navajo | 0.0 /100 | #345 | Tragic 31.6% |
Demographics Similar to Latvians by Child Poverty Under the Age of 5
In terms of child poverty under the age of 5, the demographic groups most similar to Latvians are Immigrants from Moldova (14.5%, a difference of 0.010%), Maltese (14.5%, a difference of 0.070%), Taiwanese (14.5%, a difference of 0.11%), Immigrants from Sri Lanka (14.4%, a difference of 0.41%), and Turkish (14.6%, a difference of 0.41%).
| Demographics | Rating | Rank | Child Poverty Under the Age of 5 |
| Immigrants | Indonesia | 99.8 /100 | #28 | Exceptional 14.3% |
| Immigrants | Asia | 99.8 /100 | #29 | Exceptional 14.4% |
| Cambodians | 99.8 /100 | #30 | Exceptional 14.4% |
| Koreans | 99.8 /100 | #31 | Exceptional 14.4% |
| Immigrants | Sri Lanka | 99.8 /100 | #32 | Exceptional 14.4% |
| Taiwanese | 99.8 /100 | #33 | Exceptional 14.5% |
| Immigrants | Moldova | 99.8 /100 | #34 | Exceptional 14.5% |
| Latvians | 99.8 /100 | #35 | Exceptional 14.5% |
| Maltese | 99.8 /100 | #36 | Exceptional 14.5% |
| Turks | 99.7 /100 | #37 | Exceptional 14.6% |
| Eastern Europeans | 99.7 /100 | #38 | Exceptional 14.6% |
| Norwegians | 99.7 /100 | #39 | Exceptional 14.6% |
| Immigrants | Australia | 99.7 /100 | #40 | Exceptional 14.6% |
| Immigrants | Belarus | 99.7 /100 | #41 | Exceptional 14.7% |
| Soviet Union | 99.7 /100 | #42 | Exceptional 14.7% |