Danish vs Scotch-Irish Single Male Poverty
COMPARE
Danish
Scotch-Irish
Single Male Poverty
Single Male Poverty Comparison
Danes
Scotch-Irish
12.8%
SINGLE MALE POVERTY
51.4/ 100
METRIC RATING
172nd/ 347
METRIC RANK
14.7%
SINGLE MALE POVERTY
0.0/ 100
METRIC RATING
295th/ 347
METRIC RANK
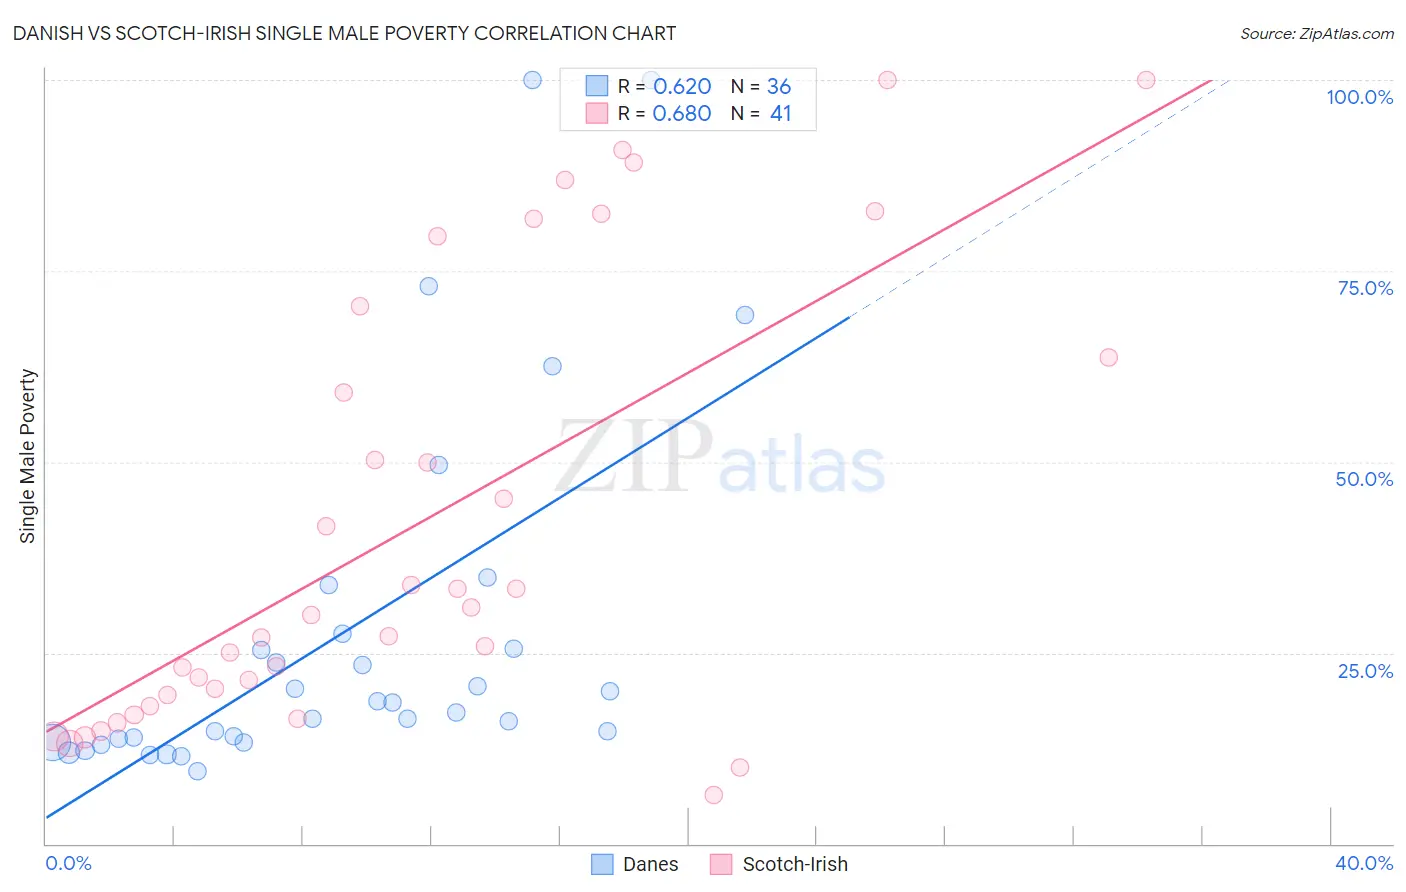
Danish vs Scotch-Irish Single Male Poverty Correlation Chart
The statistical analysis conducted on geographies consisting of 403,172,757 people shows a significant positive correlation between the proportion of Danes and poverty level among single males in the United States with a correlation coefficient (R) of 0.620 and weighted average of 12.8%. Similarly, the statistical analysis conducted on geographies consisting of 456,240,238 people shows a significant positive correlation between the proportion of Scotch-Irish and poverty level among single males in the United States with a correlation coefficient (R) of 0.680 and weighted average of 14.7%, a difference of 14.8%.
Single Male Poverty Correlation Summary
| Measurement | Danish | Scotch-Irish |
| Minimum | 9.5% | 6.4% |
| Maximum | 100.0% | 100.0% |
| Range | 90.5% | 93.6% |
| Mean | 27.5% | 41.7% |
| Median | 17.9% | 30.0% |
| Interquartile 25% (IQ1) | 13.5% | 18.7% |
| Interquartile 75% (IQ3) | 26.5% | 67.0% |
| Interquartile Range (IQR) | 13.0% | 48.3% |
| Standard Deviation (Sample) | 23.9% | 28.9% |
| Standard Deviation (Population) | 23.6% | 28.5% |
Similar Demographics by Single Male Poverty
Demographics Similar to Danes by Single Male Poverty
In terms of single male poverty, the demographic groups most similar to Danes are South African (12.8%, a difference of 0.0%), Guyanese (12.8%, a difference of 0.030%), Immigrants from St. Vincent and the Grenadines (12.8%, a difference of 0.030%), Costa Rican (12.8%, a difference of 0.080%), and Croatian (12.8%, a difference of 0.14%).
| Demographics | Rating | Rank | Single Male Poverty |
| Immigrants | Cambodia | 62.2 /100 | #165 | Good 12.7% |
| Immigrants | Guyana | 60.5 /100 | #166 | Good 12.7% |
| Immigrants | Sudan | 58.2 /100 | #167 | Average 12.7% |
| Immigrants | Barbados | 57.7 /100 | #168 | Average 12.7% |
| Puget Sound Salish | 54.3 /100 | #169 | Average 12.8% |
| Guyanese | 52.0 /100 | #170 | Average 12.8% |
| South Africans | 51.5 /100 | #171 | Average 12.8% |
| Danes | 51.4 /100 | #172 | Average 12.8% |
| Immigrants | St. Vincent and the Grenadines | 50.9 /100 | #173 | Average 12.8% |
| Costa Ricans | 50.0 /100 | #174 | Average 12.8% |
| Croatians | 48.9 /100 | #175 | Average 12.8% |
| Syrians | 48.4 /100 | #176 | Average 12.8% |
| Immigrants | Canada | 44.8 /100 | #177 | Average 12.8% |
| Immigrants | Switzerland | 43.1 /100 | #178 | Average 12.8% |
| Israelis | 41.0 /100 | #179 | Average 12.9% |
Demographics Similar to Scotch-Irish by Single Male Poverty
In terms of single male poverty, the demographic groups most similar to Scotch-Irish are African (14.7%, a difference of 0.33%), Ottawa (14.6%, a difference of 0.44%), French Canadian (14.6%, a difference of 0.63%), Immigrants from Dominican Republic (14.8%, a difference of 0.67%), and Nonimmigrants (14.6%, a difference of 0.74%).
| Demographics | Rating | Rank | Single Male Poverty |
| Whites/Caucasians | 0.0 /100 | #288 | Tragic 14.5% |
| Immigrants | Dominica | 0.0 /100 | #289 | Tragic 14.5% |
| U.S. Virgin Islanders | 0.0 /100 | #290 | Tragic 14.5% |
| Bahamians | 0.0 /100 | #291 | Tragic 14.6% |
| Immigrants | Nonimmigrants | 0.0 /100 | #292 | Tragic 14.6% |
| French Canadians | 0.0 /100 | #293 | Tragic 14.6% |
| Ottawa | 0.0 /100 | #294 | Tragic 14.6% |
| Scotch-Irish | 0.0 /100 | #295 | Tragic 14.7% |
| Africans | 0.0 /100 | #296 | Tragic 14.7% |
| Immigrants | Dominican Republic | 0.0 /100 | #297 | Tragic 14.8% |
| French American Indians | 0.0 /100 | #298 | Tragic 15.0% |
| Delaware | 0.0 /100 | #299 | Tragic 15.0% |
| Cree | 0.0 /100 | #300 | Tragic 15.1% |
| Dominicans | 0.0 /100 | #301 | Tragic 15.2% |
| Alsatians | 0.0 /100 | #302 | Tragic 15.2% |