Danish vs Salvadoran Female Poverty Among 25-34 Year Olds
COMPARE
Danish
Salvadoran
Female Poverty Among 25-34 Year Olds
Female Poverty Among 25-34 Year Olds Comparison
Danes
Salvadorans
12.8%
FEMALE POVERTY AMONG 25-34 YEAR OLDS
93.9/ 100
METRIC RATING
111th/ 347
METRIC RANK
14.7%
FEMALE POVERTY AMONG 25-34 YEAR OLDS
1.4/ 100
METRIC RATING
236th/ 347
METRIC RANK
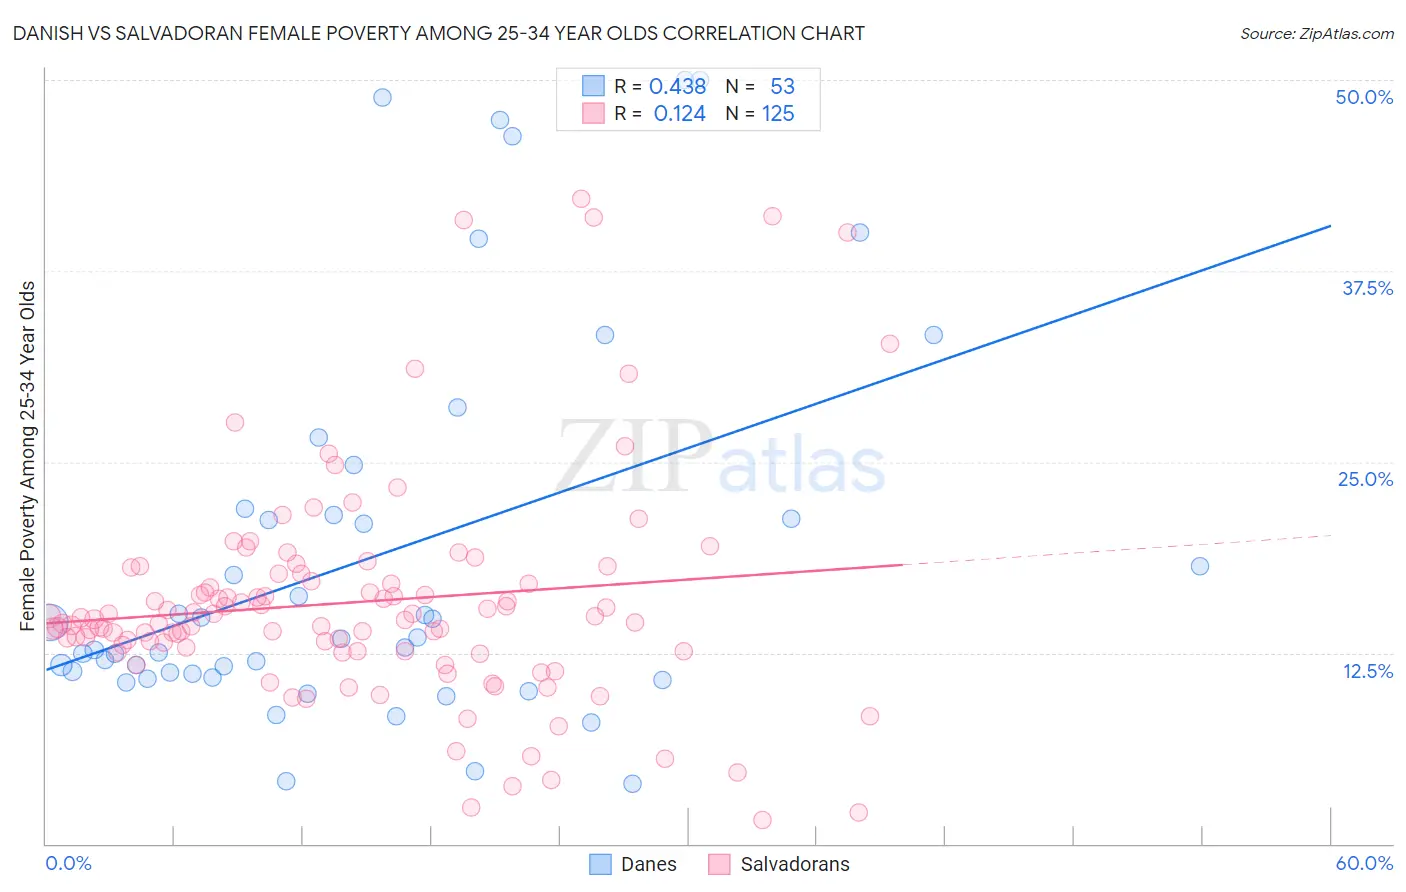
Danish vs Salvadoran Female Poverty Among 25-34 Year Olds Correlation Chart
The statistical analysis conducted on geographies consisting of 461,269,939 people shows a moderate positive correlation between the proportion of Danes and poverty level among females between the ages 25 and 34 in the United States with a correlation coefficient (R) of 0.438 and weighted average of 12.8%. Similarly, the statistical analysis conducted on geographies consisting of 394,044,278 people shows a poor positive correlation between the proportion of Salvadorans and poverty level among females between the ages 25 and 34 in the United States with a correlation coefficient (R) of 0.124 and weighted average of 14.7%, a difference of 15.4%.
Female Poverty Among 25-34 Year Olds Correlation Summary
| Measurement | Danish | Salvadoran |
| Minimum | 3.9% | 1.5% |
| Maximum | 50.0% | 42.2% |
| Range | 46.1% | 40.7% |
| Mean | 18.8% | 15.8% |
| Median | 13.4% | 14.7% |
| Interquartile 25% (IQ1) | 11.0% | 12.6% |
| Interquartile 75% (IQ3) | 21.7% | 17.4% |
| Interquartile Range (IQR) | 10.7% | 4.8% |
| Standard Deviation (Sample) | 12.5% | 7.4% |
| Standard Deviation (Population) | 12.4% | 7.3% |
Similar Demographics by Female Poverty Among 25-34 Year Olds
Demographics Similar to Danes by Female Poverty Among 25-34 Year Olds
In terms of female poverty among 25-34 year olds, the demographic groups most similar to Danes are Immigrants from Morocco (12.8%, a difference of 0.020%), Immigrants from Syria (12.8%, a difference of 0.060%), Australian (12.8%, a difference of 0.070%), Immigrants from Southern Europe (12.8%, a difference of 0.13%), and Immigrants from Peru (12.7%, a difference of 0.15%).
| Demographics | Rating | Rank | Female Poverty Among 25-34 Year Olds |
| Swedes | 95.4 /100 | #104 | Exceptional 12.7% |
| Immigrants | South Africa | 95.3 /100 | #105 | Exceptional 12.7% |
| Tsimshian | 95.1 /100 | #106 | Exceptional 12.7% |
| Poles | 94.9 /100 | #107 | Exceptional 12.7% |
| Immigrants | Norway | 94.4 /100 | #108 | Exceptional 12.7% |
| Immigrants | Peru | 94.3 /100 | #109 | Exceptional 12.7% |
| Australians | 94.1 /100 | #110 | Exceptional 12.8% |
| Danes | 93.9 /100 | #111 | Exceptional 12.8% |
| Immigrants | Morocco | 93.9 /100 | #112 | Exceptional 12.8% |
| Immigrants | Syria | 93.8 /100 | #113 | Exceptional 12.8% |
| Immigrants | Southern Europe | 93.6 /100 | #114 | Exceptional 12.8% |
| Immigrants | Brazil | 93.3 /100 | #115 | Exceptional 12.8% |
| Chileans | 93.2 /100 | #116 | Exceptional 12.8% |
| Immigrants | Kuwait | 93.1 /100 | #117 | Exceptional 12.8% |
| Mongolians | 93.0 /100 | #118 | Exceptional 12.8% |
Demographics Similar to Salvadorans by Female Poverty Among 25-34 Year Olds
In terms of female poverty among 25-34 year olds, the demographic groups most similar to Salvadorans are Immigrants from Ghana (14.7%, a difference of 0.0%), Immigrants from Jamaica (14.7%, a difference of 0.020%), Alsatian (14.7%, a difference of 0.040%), Malaysian (14.7%, a difference of 0.070%), and Immigrants from Grenada (14.7%, a difference of 0.12%).
| Demographics | Rating | Rank | Female Poverty Among 25-34 Year Olds |
| Spanish | 2.5 /100 | #229 | Tragic 14.6% |
| Spaniards | 2.3 /100 | #230 | Tragic 14.6% |
| Delaware | 2.3 /100 | #231 | Tragic 14.6% |
| Immigrants | Ecuador | 1.9 /100 | #232 | Tragic 14.6% |
| Whites/Caucasians | 1.8 /100 | #233 | Tragic 14.7% |
| Cubans | 1.6 /100 | #234 | Tragic 14.7% |
| Immigrants | Jamaica | 1.4 /100 | #235 | Tragic 14.7% |
| Salvadorans | 1.4 /100 | #236 | Tragic 14.7% |
| Immigrants | Ghana | 1.4 /100 | #237 | Tragic 14.7% |
| Alsatians | 1.4 /100 | #238 | Tragic 14.7% |
| Malaysians | 1.4 /100 | #239 | Tragic 14.7% |
| Immigrants | Grenada | 1.3 /100 | #240 | Tragic 14.7% |
| Scotch-Irish | 1.2 /100 | #241 | Tragic 14.8% |
| Barbadians | 1.2 /100 | #242 | Tragic 14.8% |
| Immigrants | Nicaragua | 1.1 /100 | #243 | Tragic 14.8% |