Czech vs Immigrants from Honduras Receiving Food Stamps
COMPARE
Czech
Immigrants from Honduras
Receiving Food Stamps
Receiving Food Stamps Comparison
Czechs
Immigrants from Honduras
9.2%
RECEIVING FOOD STAMPS
99.8/ 100
METRIC RATING
28th/ 347
METRIC RANK
15.7%
RECEIVING FOOD STAMPS
0.0/ 100
METRIC RATING
295th/ 347
METRIC RANK
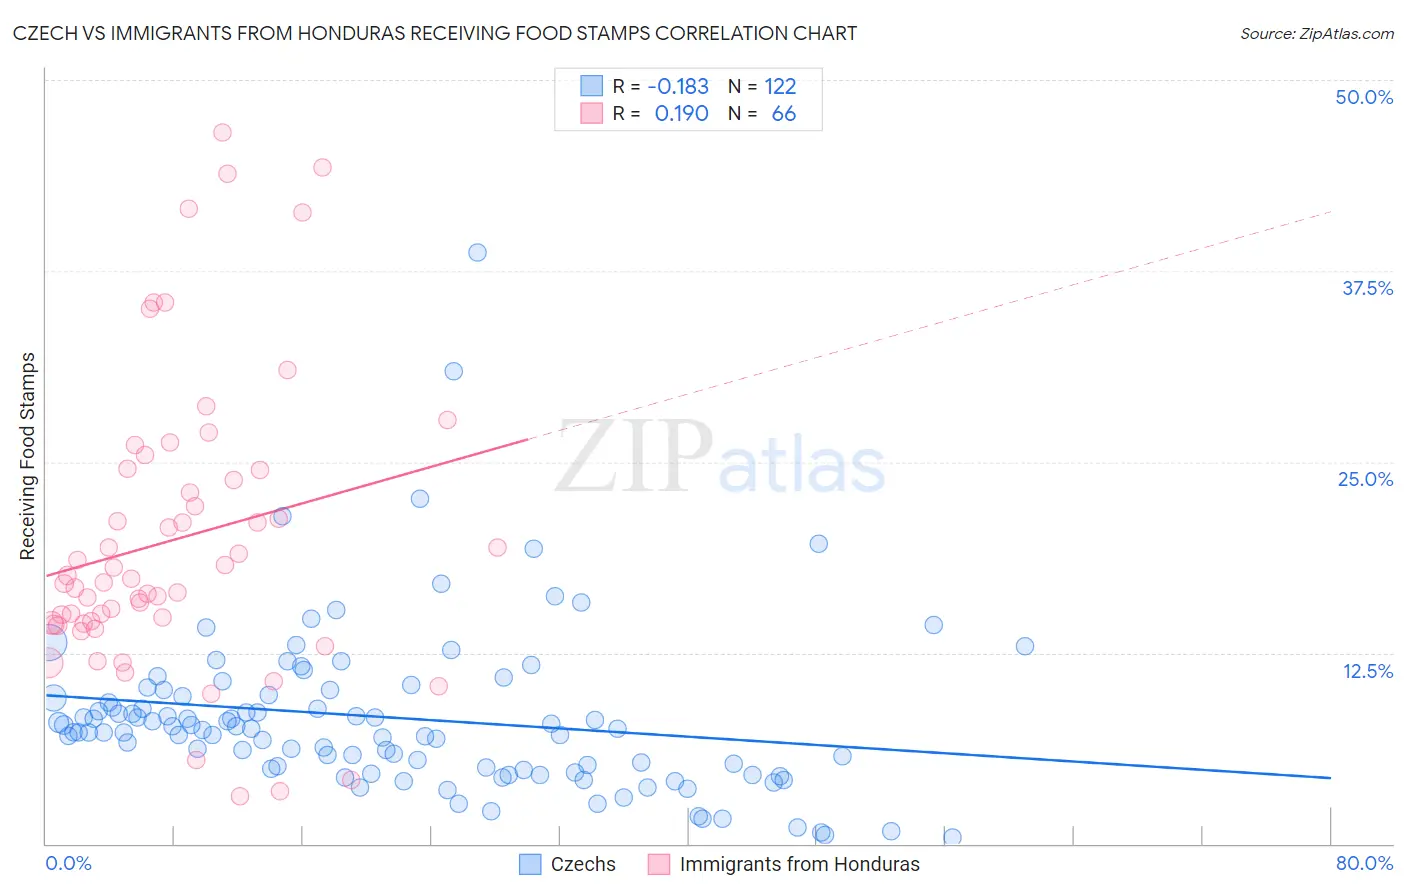
Czech vs Immigrants from Honduras Receiving Food Stamps Correlation Chart
The statistical analysis conducted on geographies consisting of 482,652,589 people shows a poor negative correlation between the proportion of Czechs and percentage of population receiving government assistance and/or food stamps in the United States with a correlation coefficient (R) of -0.183 and weighted average of 9.2%. Similarly, the statistical analysis conducted on geographies consisting of 322,297,713 people shows a poor positive correlation between the proportion of Immigrants from Honduras and percentage of population receiving government assistance and/or food stamps in the United States with a correlation coefficient (R) of 0.190 and weighted average of 15.7%, a difference of 70.6%.
Receiving Food Stamps Correlation Summary
| Measurement | Czech | Immigrants from Honduras |
| Minimum | 0.40% | 3.1% |
| Maximum | 38.7% | 46.6% |
| Range | 38.3% | 43.5% |
| Mean | 8.3% | 19.9% |
| Median | 7.5% | 17.2% |
| Interquartile 25% (IQ1) | 4.9% | 14.4% |
| Interquartile 75% (IQ3) | 9.7% | 24.5% |
| Interquartile Range (IQR) | 4.8% | 10.1% |
| Standard Deviation (Sample) | 5.5% | 9.7% |
| Standard Deviation (Population) | 5.4% | 9.6% |
Similar Demographics by Receiving Food Stamps
Demographics Similar to Czechs by Receiving Food Stamps
In terms of receiving food stamps, the demographic groups most similar to Czechs are Bhutanese (9.2%, a difference of 0.010%), Swedish (9.2%, a difference of 0.25%), Immigrants from Lithuania (9.2%, a difference of 0.27%), Immigrants from Ireland (9.2%, a difference of 0.45%), and Immigrants from Northern Europe (9.2%, a difference of 0.55%).
| Demographics | Rating | Rank | Receiving Food Stamps |
| Luxembourgers | 99.8 /100 | #21 | Exceptional 9.1% |
| Immigrants | Australia | 99.8 /100 | #22 | Exceptional 9.2% |
| Eastern Europeans | 99.8 /100 | #23 | Exceptional 9.2% |
| Immigrants | Northern Europe | 99.8 /100 | #24 | Exceptional 9.2% |
| Immigrants | Ireland | 99.8 /100 | #25 | Exceptional 9.2% |
| Swedes | 99.8 /100 | #26 | Exceptional 9.2% |
| Bhutanese | 99.8 /100 | #27 | Exceptional 9.2% |
| Czechs | 99.8 /100 | #28 | Exceptional 9.2% |
| Immigrants | Lithuania | 99.8 /100 | #29 | Exceptional 9.2% |
| Immigrants | Sweden | 99.7 /100 | #30 | Exceptional 9.3% |
| Immigrants | Eastern Asia | 99.7 /100 | #31 | Exceptional 9.3% |
| Bolivians | 99.7 /100 | #32 | Exceptional 9.3% |
| Zimbabweans | 99.6 /100 | #33 | Exceptional 9.5% |
| Turks | 99.6 /100 | #34 | Exceptional 9.5% |
| Immigrants | Austria | 99.6 /100 | #35 | Exceptional 9.5% |
Demographics Similar to Immigrants from Honduras by Receiving Food Stamps
In terms of receiving food stamps, the demographic groups most similar to Immigrants from Honduras are Tsimshian (15.7%, a difference of 0.010%), Immigrants from Bahamas (15.8%, a difference of 0.17%), Immigrants from Latin America (15.7%, a difference of 0.32%), Immigrants from Trinidad and Tobago (15.8%, a difference of 0.42%), and Vietnamese (15.7%, a difference of 0.43%).
| Demographics | Rating | Rank | Receiving Food Stamps |
| Immigrants | Belize | 0.0 /100 | #288 | Tragic 15.2% |
| Immigrants | Senegal | 0.0 /100 | #289 | Tragic 15.3% |
| Senegalese | 0.0 /100 | #290 | Tragic 15.4% |
| Hondurans | 0.0 /100 | #291 | Tragic 15.5% |
| Alaska Natives | 0.0 /100 | #292 | Tragic 15.6% |
| Vietnamese | 0.0 /100 | #293 | Tragic 15.7% |
| Immigrants | Latin America | 0.0 /100 | #294 | Tragic 15.7% |
| Immigrants | Honduras | 0.0 /100 | #295 | Tragic 15.7% |
| Tsimshian | 0.0 /100 | #296 | Tragic 15.7% |
| Immigrants | Bahamas | 0.0 /100 | #297 | Tragic 15.8% |
| Immigrants | Trinidad and Tobago | 0.0 /100 | #298 | Tragic 15.8% |
| Hispanics or Latinos | 0.0 /100 | #299 | Tragic 15.8% |
| Immigrants | Bangladesh | 0.0 /100 | #300 | Tragic 15.9% |
| Trinidadians and Tobagonians | 0.0 /100 | #301 | Tragic 16.0% |
| Immigrants | West Indies | 0.0 /100 | #302 | Tragic 16.1% |