Czechoslovakian vs Russian Single Father Poverty
COMPARE
Czechoslovakian
Russian
Single Father Poverty
Single Father Poverty Comparison
Czechoslovakians
Russians
17.1%
SINGLE FATHER POVERTY
1.3/ 100
METRIC RATING
248th/ 347
METRIC RANK
16.4%
SINGLE FATHER POVERTY
30.1/ 100
METRIC RATING
188th/ 347
METRIC RANK
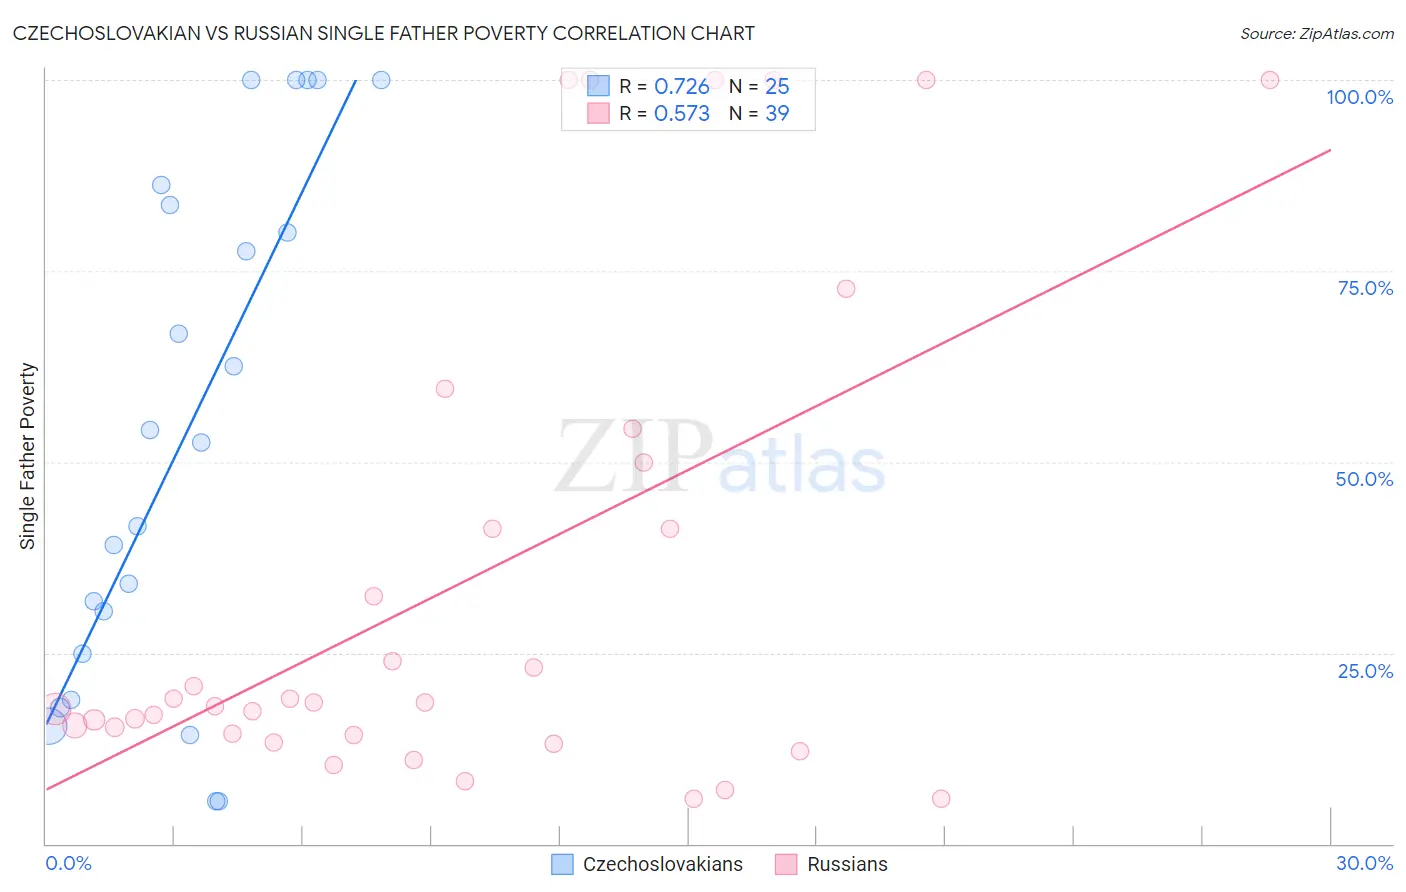
Czechoslovakian vs Russian Single Father Poverty Correlation Chart
The statistical analysis conducted on geographies consisting of 285,091,389 people shows a strong positive correlation between the proportion of Czechoslovakians and poverty level among single fathers in the United States with a correlation coefficient (R) of 0.726 and weighted average of 17.1%. Similarly, the statistical analysis conducted on geographies consisting of 378,661,966 people shows a substantial positive correlation between the proportion of Russians and poverty level among single fathers in the United States with a correlation coefficient (R) of 0.573 and weighted average of 16.4%, a difference of 3.8%.
Single Father Poverty Correlation Summary
| Measurement | Czechoslovakian | Russian |
| Minimum | 5.5% | 5.9% |
| Maximum | 100.0% | 100.0% |
| Range | 94.5% | 94.1% |
| Mean | 53.7% | 34.4% |
| Median | 52.6% | 18.4% |
| Interquartile 25% (IQ1) | 21.8% | 14.2% |
| Interquartile 75% (IQ3) | 85.0% | 50.0% |
| Interquartile Range (IQR) | 63.1% | 35.8% |
| Standard Deviation (Sample) | 33.5% | 32.0% |
| Standard Deviation (Population) | 32.8% | 31.6% |
Similar Demographics by Single Father Poverty
Demographics Similar to Czechoslovakians by Single Father Poverty
In terms of single father poverty, the demographic groups most similar to Czechoslovakians are Greek (17.1%, a difference of 0.0%), Canadian (17.1%, a difference of 0.040%), Immigrants from Ireland (17.1%, a difference of 0.10%), Trinidadian and Tobagonian (17.0%, a difference of 0.14%), and Austrian (17.1%, a difference of 0.17%).
| Demographics | Rating | Rank | Single Father Poverty |
| Czechs | 2.3 /100 | #241 | Tragic 17.0% |
| Moroccans | 2.1 /100 | #242 | Tragic 17.0% |
| Immigrants | Cabo Verde | 1.6 /100 | #243 | Tragic 17.0% |
| Hondurans | 1.6 /100 | #244 | Tragic 17.0% |
| Trinidadians and Tobagonians | 1.5 /100 | #245 | Tragic 17.0% |
| Immigrants | Ireland | 1.4 /100 | #246 | Tragic 17.1% |
| Greeks | 1.3 /100 | #247 | Tragic 17.1% |
| Czechoslovakians | 1.3 /100 | #248 | Tragic 17.1% |
| Canadians | 1.3 /100 | #249 | Tragic 17.1% |
| Austrians | 1.1 /100 | #250 | Tragic 17.1% |
| Luxembourgers | 1.1 /100 | #251 | Tragic 17.1% |
| Croatians | 1.0 /100 | #252 | Tragic 17.1% |
| Cree | 1.0 /100 | #253 | Tragic 17.1% |
| Immigrants | Honduras | 0.9 /100 | #254 | Tragic 17.1% |
| Sierra Leoneans | 0.8 /100 | #255 | Tragic 17.2% |
Demographics Similar to Russians by Single Father Poverty
In terms of single father poverty, the demographic groups most similar to Russians are Ukrainian (16.4%, a difference of 0.020%), Immigrants from Venezuela (16.4%, a difference of 0.050%), Latvian (16.5%, a difference of 0.060%), Immigrants from Burma/Myanmar (16.5%, a difference of 0.11%), and Immigrants from Guyana (16.5%, a difference of 0.16%).
| Demographics | Rating | Rank | Single Father Poverty |
| Immigrants | Western Africa | 36.0 /100 | #181 | Fair 16.4% |
| Immigrants | Italy | 35.7 /100 | #182 | Fair 16.4% |
| Aleuts | 35.3 /100 | #183 | Fair 16.4% |
| Cambodians | 34.6 /100 | #184 | Fair 16.4% |
| Panamanians | 33.6 /100 | #185 | Fair 16.4% |
| Immigrants | Venezuela | 31.0 /100 | #186 | Fair 16.4% |
| Ukrainians | 30.4 /100 | #187 | Fair 16.4% |
| Russians | 30.1 /100 | #188 | Fair 16.4% |
| Latvians | 28.9 /100 | #189 | Fair 16.5% |
| Immigrants | Burma/Myanmar | 28.0 /100 | #190 | Fair 16.5% |
| Immigrants | Guyana | 27.1 /100 | #191 | Fair 16.5% |
| Immigrants | Switzerland | 24.8 /100 | #192 | Fair 16.5% |
| Ecuadorians | 24.5 /100 | #193 | Fair 16.5% |
| Cape Verdeans | 24.4 /100 | #194 | Fair 16.5% |
| Immigrants | Barbados | 24.3 /100 | #195 | Fair 16.5% |