Czechoslovakian vs Immigrants from Korea Single Father Poverty
COMPARE
Czechoslovakian
Immigrants from Korea
Single Father Poverty
Single Father Poverty Comparison
Czechoslovakians
Immigrants from Korea
17.1%
SINGLE FATHER POVERTY
1.3/ 100
METRIC RATING
248th/ 347
METRIC RANK
15.5%
SINGLE FATHER POVERTY
99.0/ 100
METRIC RATING
89th/ 347
METRIC RANK
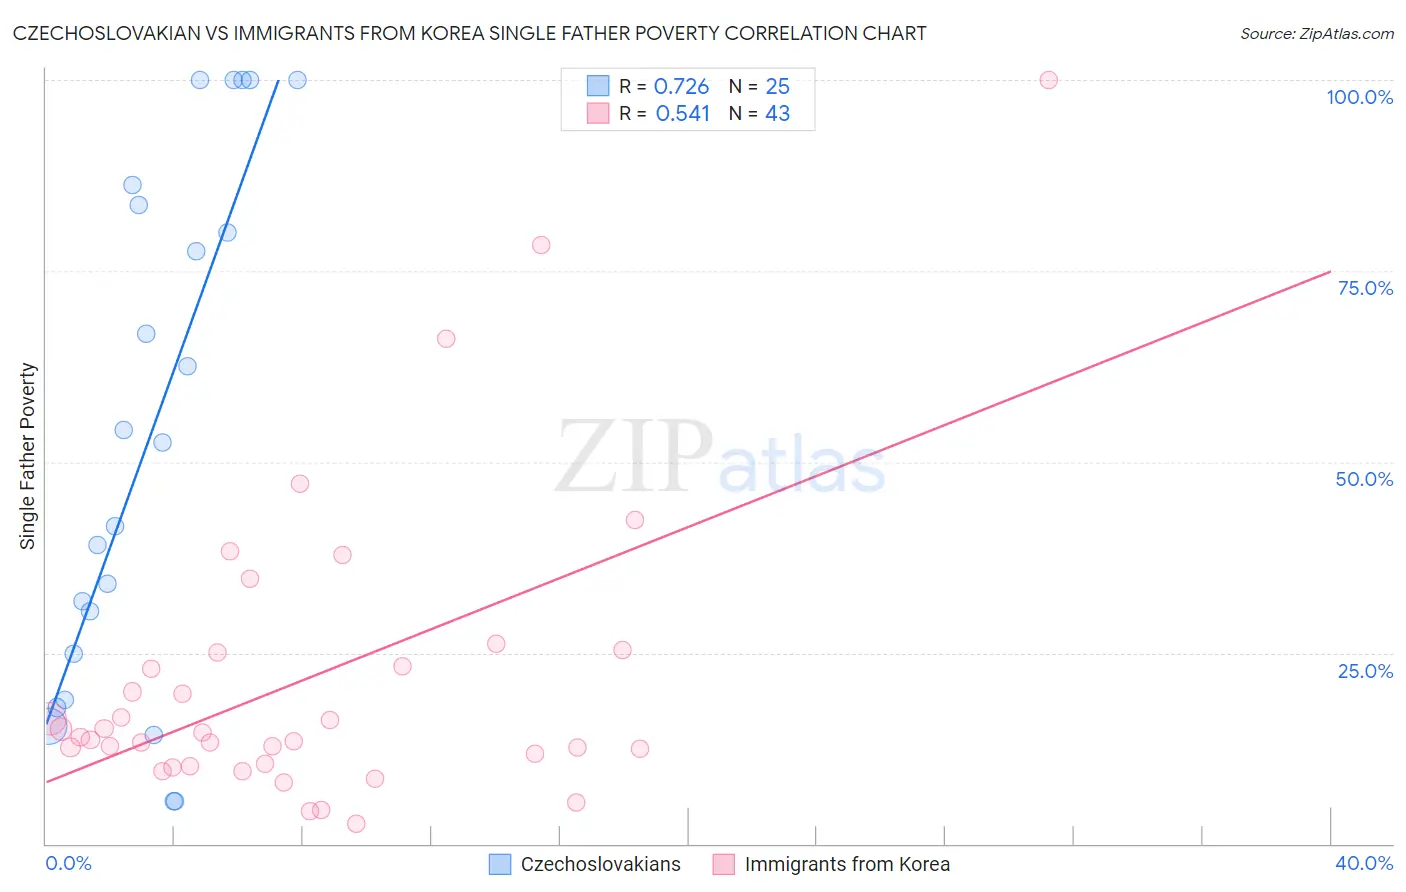
Czechoslovakian vs Immigrants from Korea Single Father Poverty Correlation Chart
The statistical analysis conducted on geographies consisting of 285,091,389 people shows a strong positive correlation between the proportion of Czechoslovakians and poverty level among single fathers in the United States with a correlation coefficient (R) of 0.726 and weighted average of 17.1%. Similarly, the statistical analysis conducted on geographies consisting of 322,299,273 people shows a substantial positive correlation between the proportion of Immigrants from Korea and poverty level among single fathers in the United States with a correlation coefficient (R) of 0.541 and weighted average of 15.5%, a difference of 10.3%.
Single Father Poverty Correlation Summary
| Measurement | Czechoslovakian | Immigrants from Korea |
| Minimum | 5.5% | 2.7% |
| Maximum | 100.0% | 100.0% |
| Range | 94.5% | 97.3% |
| Mean | 53.7% | 21.6% |
| Median | 52.6% | 13.9% |
| Interquartile 25% (IQ1) | 21.8% | 10.5% |
| Interquartile 75% (IQ3) | 85.0% | 25.0% |
| Interquartile Range (IQR) | 63.1% | 14.5% |
| Standard Deviation (Sample) | 33.5% | 19.8% |
| Standard Deviation (Population) | 32.8% | 19.6% |
Similar Demographics by Single Father Poverty
Demographics Similar to Czechoslovakians by Single Father Poverty
In terms of single father poverty, the demographic groups most similar to Czechoslovakians are Greek (17.1%, a difference of 0.0%), Canadian (17.1%, a difference of 0.040%), Immigrants from Ireland (17.1%, a difference of 0.10%), Trinidadian and Tobagonian (17.0%, a difference of 0.14%), and Austrian (17.1%, a difference of 0.17%).
| Demographics | Rating | Rank | Single Father Poverty |
| Czechs | 2.3 /100 | #241 | Tragic 17.0% |
| Moroccans | 2.1 /100 | #242 | Tragic 17.0% |
| Immigrants | Cabo Verde | 1.6 /100 | #243 | Tragic 17.0% |
| Hondurans | 1.6 /100 | #244 | Tragic 17.0% |
| Trinidadians and Tobagonians | 1.5 /100 | #245 | Tragic 17.0% |
| Immigrants | Ireland | 1.4 /100 | #246 | Tragic 17.1% |
| Greeks | 1.3 /100 | #247 | Tragic 17.1% |
| Czechoslovakians | 1.3 /100 | #248 | Tragic 17.1% |
| Canadians | 1.3 /100 | #249 | Tragic 17.1% |
| Austrians | 1.1 /100 | #250 | Tragic 17.1% |
| Luxembourgers | 1.1 /100 | #251 | Tragic 17.1% |
| Croatians | 1.0 /100 | #252 | Tragic 17.1% |
| Cree | 1.0 /100 | #253 | Tragic 17.1% |
| Immigrants | Honduras | 0.9 /100 | #254 | Tragic 17.1% |
| Sierra Leoneans | 0.8 /100 | #255 | Tragic 17.2% |
Demographics Similar to Immigrants from Korea by Single Father Poverty
In terms of single father poverty, the demographic groups most similar to Immigrants from Korea are Burmese (15.5%, a difference of 0.060%), Brazilian (15.5%, a difference of 0.090%), Immigrants from Russia (15.5%, a difference of 0.10%), Immigrants from Oceania (15.4%, a difference of 0.22%), and Mexican American Indian (15.5%, a difference of 0.23%).
| Demographics | Rating | Rank | Single Father Poverty |
| Immigrants | Ukraine | 99.4 /100 | #82 | Exceptional 15.4% |
| Chinese | 99.3 /100 | #83 | Exceptional 15.4% |
| Peruvians | 99.2 /100 | #84 | Exceptional 15.4% |
| Immigrants | Oceania | 99.1 /100 | #85 | Exceptional 15.4% |
| Immigrants | Russia | 99.0 /100 | #86 | Exceptional 15.5% |
| Brazilians | 99.0 /100 | #87 | Exceptional 15.5% |
| Burmese | 99.0 /100 | #88 | Exceptional 15.5% |
| Immigrants | Korea | 99.0 /100 | #89 | Exceptional 15.5% |
| Mexican American Indians | 98.7 /100 | #90 | Exceptional 15.5% |
| Immigrants | Romania | 98.6 /100 | #91 | Exceptional 15.5% |
| Immigrants | Serbia | 98.5 /100 | #92 | Exceptional 15.5% |
| Basques | 98.4 /100 | #93 | Exceptional 15.5% |
| Immigrants | Uruguay | 98.2 /100 | #94 | Exceptional 15.6% |
| Immigrants | Kazakhstan | 98.2 /100 | #95 | Exceptional 15.6% |
| Immigrants | Belgium | 98.1 /100 | #96 | Exceptional 15.6% |