Czechoslovakian vs Immigrants from Venezuela Male Poverty
COMPARE
Czechoslovakian
Immigrants from Venezuela
Male Poverty
Male Poverty Comparison
Czechoslovakians
Immigrants from Venezuela
10.3%
MALE POVERTY
95.6/ 100
METRIC RATING
84th/ 347
METRIC RANK
11.0%
MALE POVERTY
67.9/ 100
METRIC RATING
149th/ 347
METRIC RANK
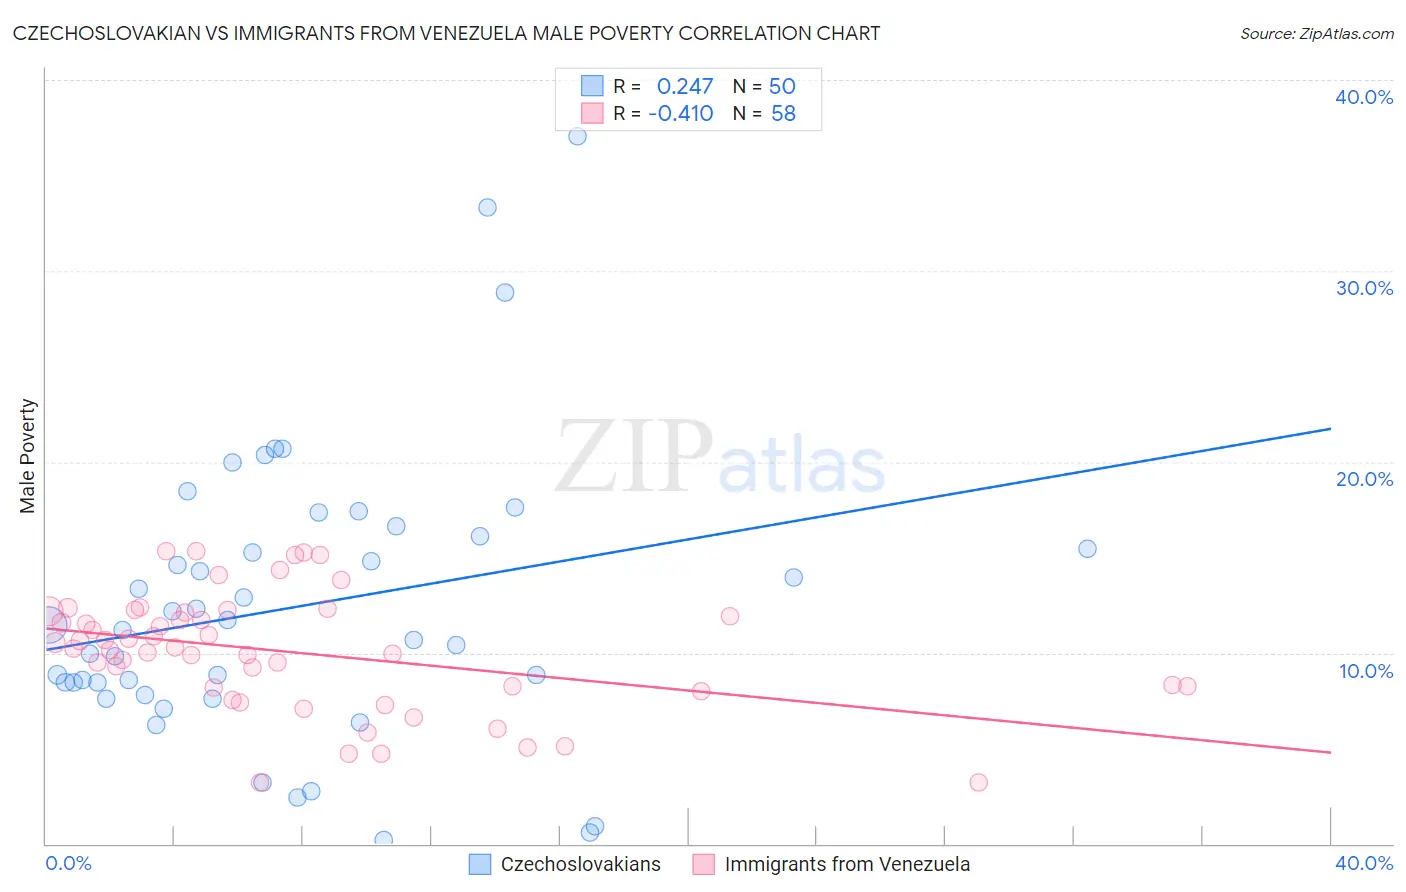
Czechoslovakian vs Immigrants from Venezuela Male Poverty Correlation Chart
The statistical analysis conducted on geographies consisting of 368,409,681 people shows a weak positive correlation between the proportion of Czechoslovakians and poverty level among males in the United States with a correlation coefficient (R) of 0.247 and weighted average of 10.3%. Similarly, the statistical analysis conducted on geographies consisting of 287,626,289 people shows a moderate negative correlation between the proportion of Immigrants from Venezuela and poverty level among males in the United States with a correlation coefficient (R) of -0.410 and weighted average of 11.0%, a difference of 6.2%.
Male Poverty Correlation Summary
| Measurement | Czechoslovakian | Immigrants from Venezuela |
| Minimum | 0.22% | 3.2% |
| Maximum | 37.0% | 15.3% |
| Range | 36.8% | 12.2% |
| Mean | 12.4% | 10.0% |
| Median | 11.3% | 10.2% |
| Interquartile 25% (IQ1) | 8.4% | 8.2% |
| Interquartile 75% (IQ3) | 16.1% | 12.1% |
| Interquartile Range (IQR) | 7.7% | 3.9% |
| Standard Deviation (Sample) | 7.5% | 3.1% |
| Standard Deviation (Population) | 7.4% | 3.0% |
Similar Demographics by Male Poverty
Demographics Similar to Czechoslovakians by Male Poverty
In terms of male poverty, the demographic groups most similar to Czechoslovakians are Immigrants from England (10.4%, a difference of 0.050%), Immigrants from Sweden (10.3%, a difference of 0.060%), Immigrants from Eastern Asia (10.4%, a difference of 0.18%), Belgian (10.3%, a difference of 0.19%), and Egyptian (10.3%, a difference of 0.19%).
| Demographics | Rating | Rank | Male Poverty |
| Immigrants | Belgium | 96.8 /100 | #77 | Exceptional 10.3% |
| Irish | 96.8 /100 | #78 | Exceptional 10.3% |
| Immigrants | North America | 96.5 /100 | #79 | Exceptional 10.3% |
| English | 96.4 /100 | #80 | Exceptional 10.3% |
| Belgians | 95.9 /100 | #81 | Exceptional 10.3% |
| Egyptians | 95.9 /100 | #82 | Exceptional 10.3% |
| Immigrants | Sweden | 95.7 /100 | #83 | Exceptional 10.3% |
| Czechoslovakians | 95.6 /100 | #84 | Exceptional 10.3% |
| Immigrants | England | 95.5 /100 | #85 | Exceptional 10.4% |
| Immigrants | Eastern Asia | 95.3 /100 | #86 | Exceptional 10.4% |
| Northern Europeans | 95.2 /100 | #87 | Exceptional 10.4% |
| Cambodians | 95.0 /100 | #88 | Exceptional 10.4% |
| Immigrants | Denmark | 95.0 /100 | #89 | Exceptional 10.4% |
| Indians (Asian) | 94.9 /100 | #90 | Exceptional 10.4% |
| British | 94.8 /100 | #91 | Exceptional 10.4% |
Demographics Similar to Immigrants from Venezuela by Male Poverty
In terms of male poverty, the demographic groups most similar to Immigrants from Venezuela are Armenian (11.0%, a difference of 0.020%), Guamanian/Chamorro (11.0%, a difference of 0.040%), Venezuelan (11.0%, a difference of 0.060%), Icelander (11.0%, a difference of 0.070%), and Immigrants from Nepal (11.0%, a difference of 0.070%).
| Demographics | Rating | Rank | Male Poverty |
| Basques | 74.6 /100 | #142 | Good 10.9% |
| Afghans | 71.9 /100 | #143 | Good 10.9% |
| Samoans | 71.8 /100 | #144 | Good 10.9% |
| Immigrants | Germany | 71.6 /100 | #145 | Good 10.9% |
| Syrians | 71.4 /100 | #146 | Good 10.9% |
| Icelanders | 68.5 /100 | #147 | Good 11.0% |
| Armenians | 68.0 /100 | #148 | Good 11.0% |
| Immigrants | Venezuela | 67.9 /100 | #149 | Good 11.0% |
| Guamanians/Chamorros | 67.6 /100 | #150 | Good 11.0% |
| Venezuelans | 67.4 /100 | #151 | Good 11.0% |
| Immigrants | Nepal | 67.3 /100 | #152 | Good 11.0% |
| Immigrants | Bosnia and Herzegovina | 65.2 /100 | #153 | Good 11.0% |
| Immigrants | Kazakhstan | 64.8 /100 | #154 | Good 11.0% |
| Immigrants | Malaysia | 64.7 /100 | #155 | Good 11.0% |
| Costa Ricans | 63.9 /100 | #156 | Good 11.0% |