Czechoslovakian vs Immigrants from Bosnia and Herzegovina 1 or more Vehicles in Household
COMPARE
Czechoslovakian
Immigrants from Bosnia and Herzegovina
1 or more Vehicles in Household
1 or more Vehicles in Household Comparison
Czechoslovakians
Immigrants from Bosnia and Herzegovina
92.3%
1 OR MORE VEHICLES IN HOUSEHOLD
99.9/ 100
METRIC RATING
35th/ 347
METRIC RANK
90.1%
1 OR MORE VEHICLES IN HOUSEHOLD
75.4/ 100
METRIC RATING
151st/ 347
METRIC RANK
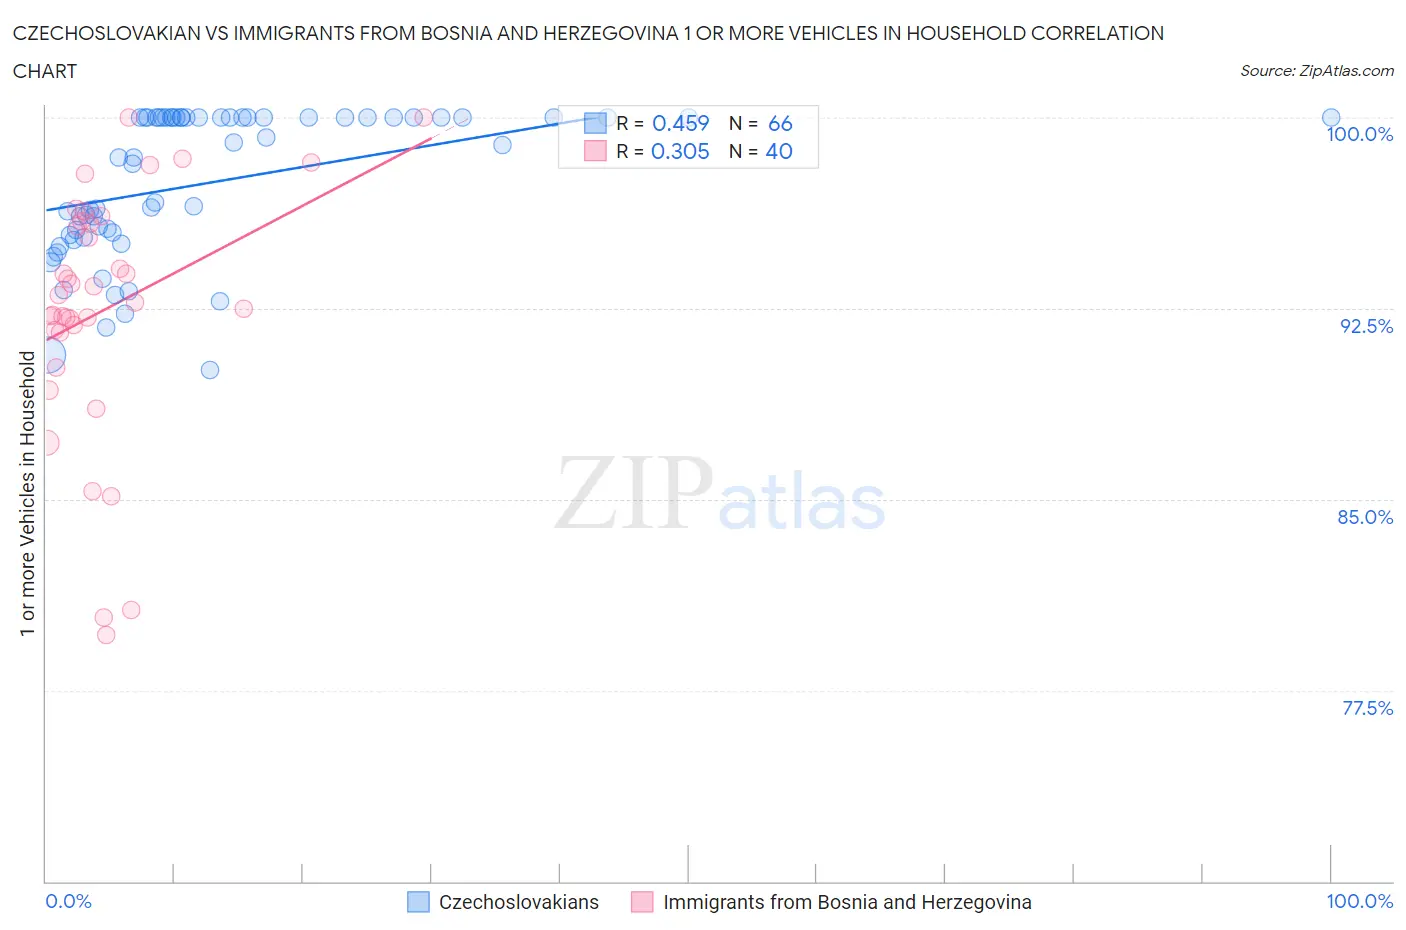
Czechoslovakian vs Immigrants from Bosnia and Herzegovina 1 or more Vehicles in Household Correlation Chart
The statistical analysis conducted on geographies consisting of 368,548,563 people shows a moderate positive correlation between the proportion of Czechoslovakians and percentage of households with 1 or more vehicles available in the United States with a correlation coefficient (R) of 0.459 and weighted average of 92.3%. Similarly, the statistical analysis conducted on geographies consisting of 156,805,510 people shows a mild positive correlation between the proportion of Immigrants from Bosnia and Herzegovina and percentage of households with 1 or more vehicles available in the United States with a correlation coefficient (R) of 0.305 and weighted average of 90.1%, a difference of 2.5%.
1 or more Vehicles in Household Correlation Summary
| Measurement | Czechoslovakian | Immigrants from Bosnia and Herzegovina |
| Minimum | 90.1% | 79.7% |
| Maximum | 100.0% | 100.0% |
| Range | 9.9% | 20.3% |
| Mean | 97.5% | 92.5% |
| Median | 98.7% | 92.9% |
| Interquartile 25% (IQ1) | 95.4% | 91.6% |
| Interquartile 75% (IQ3) | 100.0% | 95.9% |
| Interquartile Range (IQR) | 4.6% | 4.3% |
| Standard Deviation (Sample) | 2.9% | 4.9% |
| Standard Deviation (Population) | 2.8% | 4.9% |
Similar Demographics by 1 or more Vehicles in Household
Demographics Similar to Czechoslovakians by 1 or more Vehicles in Household
In terms of 1 or more vehicles in household, the demographic groups most similar to Czechoslovakians are Malaysian (92.3%, a difference of 0.0%), Italian (92.3%, a difference of 0.010%), French Canadian (92.3%, a difference of 0.010%), Immigrants from Vietnam (92.3%, a difference of 0.020%), and Swiss (92.3%, a difference of 0.020%).
| Demographics | Rating | Rank | 1 or more Vehicles in Household |
| Sri Lankans | 100.0 /100 | #28 | Exceptional 92.5% |
| Native Hawaiians | 100.0 /100 | #29 | Exceptional 92.4% |
| Finns | 100.0 /100 | #30 | Exceptional 92.4% |
| Samoans | 100.0 /100 | #31 | Exceptional 92.4% |
| Basques | 100.0 /100 | #32 | Exceptional 92.4% |
| Cherokee | 100.0 /100 | #33 | Exceptional 92.4% |
| Italians | 99.9 /100 | #34 | Exceptional 92.3% |
| Czechoslovakians | 99.9 /100 | #35 | Exceptional 92.3% |
| Malaysians | 99.9 /100 | #36 | Exceptional 92.3% |
| French Canadians | 99.9 /100 | #37 | Exceptional 92.3% |
| Immigrants | Vietnam | 99.9 /100 | #38 | Exceptional 92.3% |
| Swiss | 99.9 /100 | #39 | Exceptional 92.3% |
| Creek | 99.9 /100 | #40 | Exceptional 92.3% |
| Immigrants | Taiwan | 99.9 /100 | #41 | Exceptional 92.3% |
| Chickasaw | 99.9 /100 | #42 | Exceptional 92.3% |
Demographics Similar to Immigrants from Bosnia and Herzegovina by 1 or more Vehicles in Household
In terms of 1 or more vehicles in household, the demographic groups most similar to Immigrants from Bosnia and Herzegovina are Immigrants from Micronesia (90.1%, a difference of 0.010%), Tlingit-Haida (90.1%, a difference of 0.020%), Immigrants from Nicaragua (90.1%, a difference of 0.030%), New Zealander (90.1%, a difference of 0.030%), and Immigrants from Uganda (90.1%, a difference of 0.030%).
| Demographics | Rating | Rank | 1 or more Vehicles in Household |
| Immigrants | Zimbabwe | 81.5 /100 | #144 | Excellent 90.2% |
| Sioux | 81.3 /100 | #145 | Excellent 90.2% |
| Bahamians | 80.5 /100 | #146 | Excellent 90.2% |
| Chileans | 79.8 /100 | #147 | Good 90.2% |
| Immigrants | Eastern Africa | 78.2 /100 | #148 | Good 90.1% |
| Immigrants | Nicaragua | 76.7 /100 | #149 | Good 90.1% |
| Immigrants | Micronesia | 75.9 /100 | #150 | Good 90.1% |
| Immigrants | Bosnia and Herzegovina | 75.4 /100 | #151 | Good 90.1% |
| Tlingit-Haida | 74.3 /100 | #152 | Good 90.1% |
| New Zealanders | 73.8 /100 | #153 | Good 90.1% |
| Immigrants | Uganda | 73.8 /100 | #154 | Good 90.1% |
| Immigrants | Immigrants | 73.6 /100 | #155 | Good 90.1% |
| Australians | 72.4 /100 | #156 | Good 90.0% |
| Immigrants | Congo | 71.2 /100 | #157 | Good 90.0% |
| Brazilians | 71.0 /100 | #158 | Good 90.0% |