Cuban vs Immigrants from Dominica Single Father Households
COMPARE
Cuban
Immigrants from Dominica
Single Father Households
Single Father Households Comparison
Cubans
Immigrants from Dominica
2.6%
SINGLE FATHER HOUSEHOLDS
0.3/ 100
METRIC RATING
269th/ 347
METRIC RANK
2.5%
SINGLE FATHER HOUSEHOLDS
4.8/ 100
METRIC RATING
240th/ 347
METRIC RANK
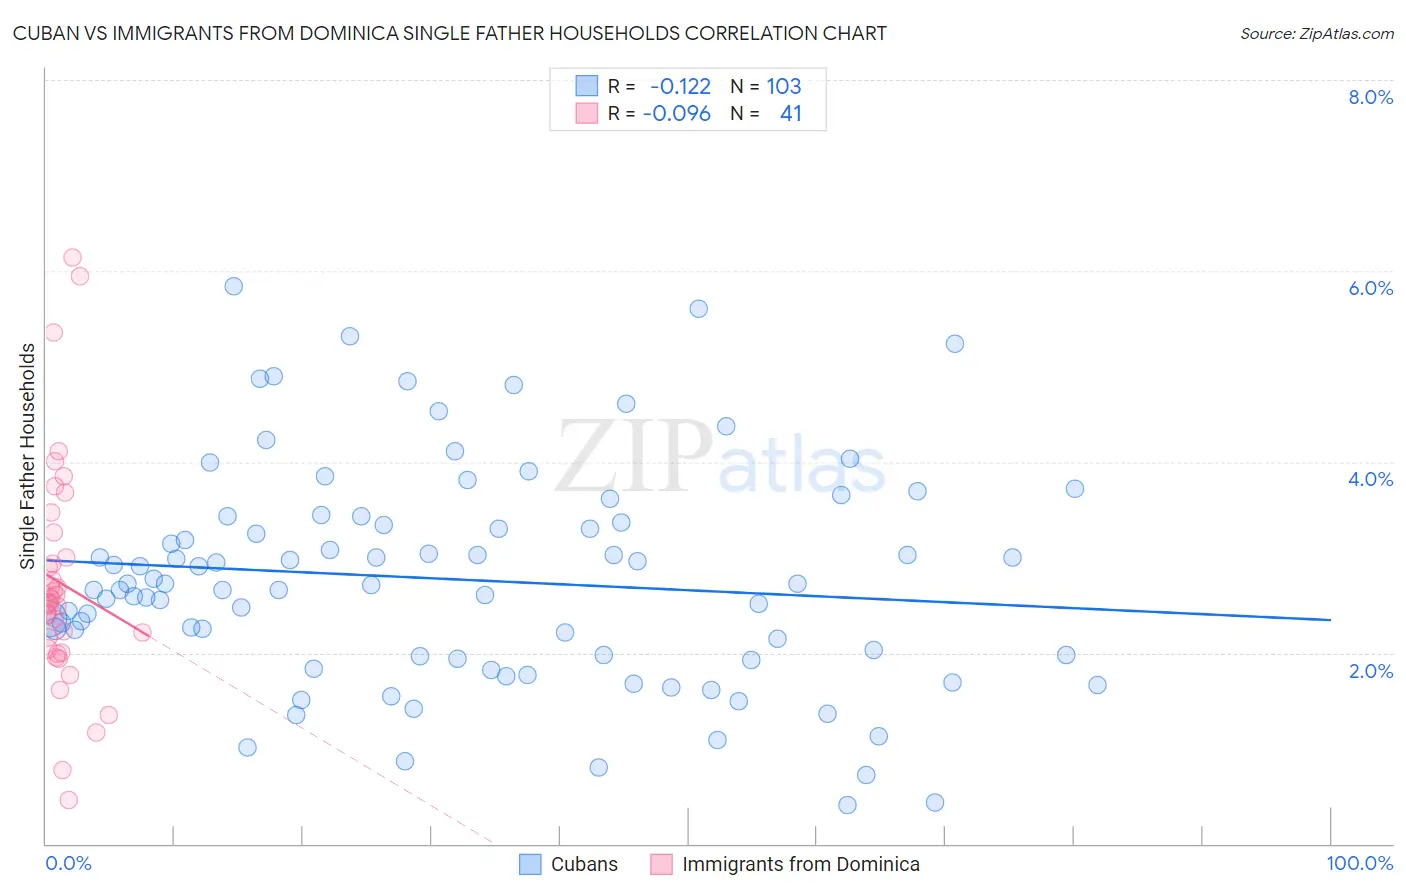
Cuban vs Immigrants from Dominica Single Father Households Correlation Chart
The statistical analysis conducted on geographies consisting of 444,378,615 people shows a poor negative correlation between the proportion of Cubans and percentage of single father households in the United States with a correlation coefficient (R) of -0.122 and weighted average of 2.6%. Similarly, the statistical analysis conducted on geographies consisting of 83,648,183 people shows a slight negative correlation between the proportion of Immigrants from Dominica and percentage of single father households in the United States with a correlation coefficient (R) of -0.096 and weighted average of 2.5%, a difference of 5.0%.
Single Father Households Correlation Summary
| Measurement | Cuban | Immigrants from Dominica |
| Minimum | 0.41% | 0.46% |
| Maximum | 5.8% | 6.1% |
| Range | 5.4% | 5.7% |
| Mean | 2.8% | 2.7% |
| Median | 2.7% | 2.5% |
| Interquartile 25% (IQ1) | 2.0% | 2.0% |
| Interquartile 75% (IQ3) | 3.4% | 3.1% |
| Interquartile Range (IQR) | 1.4% | 1.1% |
| Standard Deviation (Sample) | 1.1% | 1.2% |
| Standard Deviation (Population) | 1.1% | 1.2% |
Similar Demographics by Single Father Households
Demographics Similar to Cubans by Single Father Households
In terms of single father households, the demographic groups most similar to Cubans are Seminole (2.6%, a difference of 0.14%), Haitian (2.6%, a difference of 0.34%), Guamanian/Chamorro (2.6%, a difference of 0.38%), Creek (2.6%, a difference of 0.50%), and Belizean (2.6%, a difference of 0.50%).
| Demographics | Rating | Rank | Single Father Households |
| Immigrants | Liberia | 0.8 /100 | #262 | Tragic 2.5% |
| Dominicans | 0.8 /100 | #263 | Tragic 2.5% |
| Indonesians | 0.5 /100 | #264 | Tragic 2.6% |
| Immigrants | Micronesia | 0.5 /100 | #265 | Tragic 2.6% |
| French American Indians | 0.5 /100 | #266 | Tragic 2.6% |
| Guamanians/Chamorros | 0.4 /100 | #267 | Tragic 2.6% |
| Haitians | 0.4 /100 | #268 | Tragic 2.6% |
| Cubans | 0.3 /100 | #269 | Tragic 2.6% |
| Seminole | 0.3 /100 | #270 | Tragic 2.6% |
| Creek | 0.2 /100 | #271 | Tragic 2.6% |
| Belizeans | 0.2 /100 | #272 | Tragic 2.6% |
| Iroquois | 0.2 /100 | #273 | Tragic 2.6% |
| Puerto Ricans | 0.2 /100 | #274 | Tragic 2.6% |
| Immigrants | Dominican Republic | 0.2 /100 | #275 | Tragic 2.6% |
| Immigrants | Haiti | 0.1 /100 | #276 | Tragic 2.6% |
Demographics Similar to Immigrants from Dominica by Single Father Households
In terms of single father households, the demographic groups most similar to Immigrants from Dominica are Portuguese (2.5%, a difference of 0.26%), Osage (2.5%, a difference of 0.29%), Immigrants from Oceania (2.5%, a difference of 0.36%), Immigrants from Sierra Leone (2.5%, a difference of 0.37%), and Sierra Leonean (2.5%, a difference of 0.41%).
| Demographics | Rating | Rank | Single Father Households |
| Immigrants | Western Africa | 7.0 /100 | #233 | Tragic 2.4% |
| Africans | 6.3 /100 | #234 | Tragic 2.5% |
| Immigrants | Immigrants | 6.3 /100 | #235 | Tragic 2.5% |
| Cajuns | 6.1 /100 | #236 | Tragic 2.5% |
| Sierra Leoneans | 5.9 /100 | #237 | Tragic 2.5% |
| Immigrants | Sierra Leone | 5.8 /100 | #238 | Tragic 2.5% |
| Immigrants | Oceania | 5.8 /100 | #239 | Tragic 2.5% |
| Immigrants | Dominica | 4.8 /100 | #240 | Tragic 2.5% |
| Portuguese | 4.1 /100 | #241 | Tragic 2.5% |
| Osage | 4.1 /100 | #242 | Tragic 2.5% |
| Spaniards | 3.1 /100 | #243 | Tragic 2.5% |
| Immigrants | Middle Africa | 2.8 /100 | #244 | Tragic 2.5% |
| Basques | 2.5 /100 | #245 | Tragic 2.5% |
| Native Hawaiians | 2.5 /100 | #246 | Tragic 2.5% |
| Delaware | 2.5 /100 | #247 | Tragic 2.5% |