Crow vs Somali Householder Income Ages 25 - 44 years
COMPARE
Crow
Somali
Householder Income Ages 25 - 44 years
Householder Income Ages 25 - 44 years Comparison
Crow
Somalis
$71,337
HOUSEHOLDER INCOME AGES 25 - 44 YEARS
0.0/ 100
METRIC RATING
342nd/ 347
METRIC RANK
$83,752
HOUSEHOLDER INCOME AGES 25 - 44 YEARS
0.2/ 100
METRIC RATING
271st/ 347
METRIC RANK
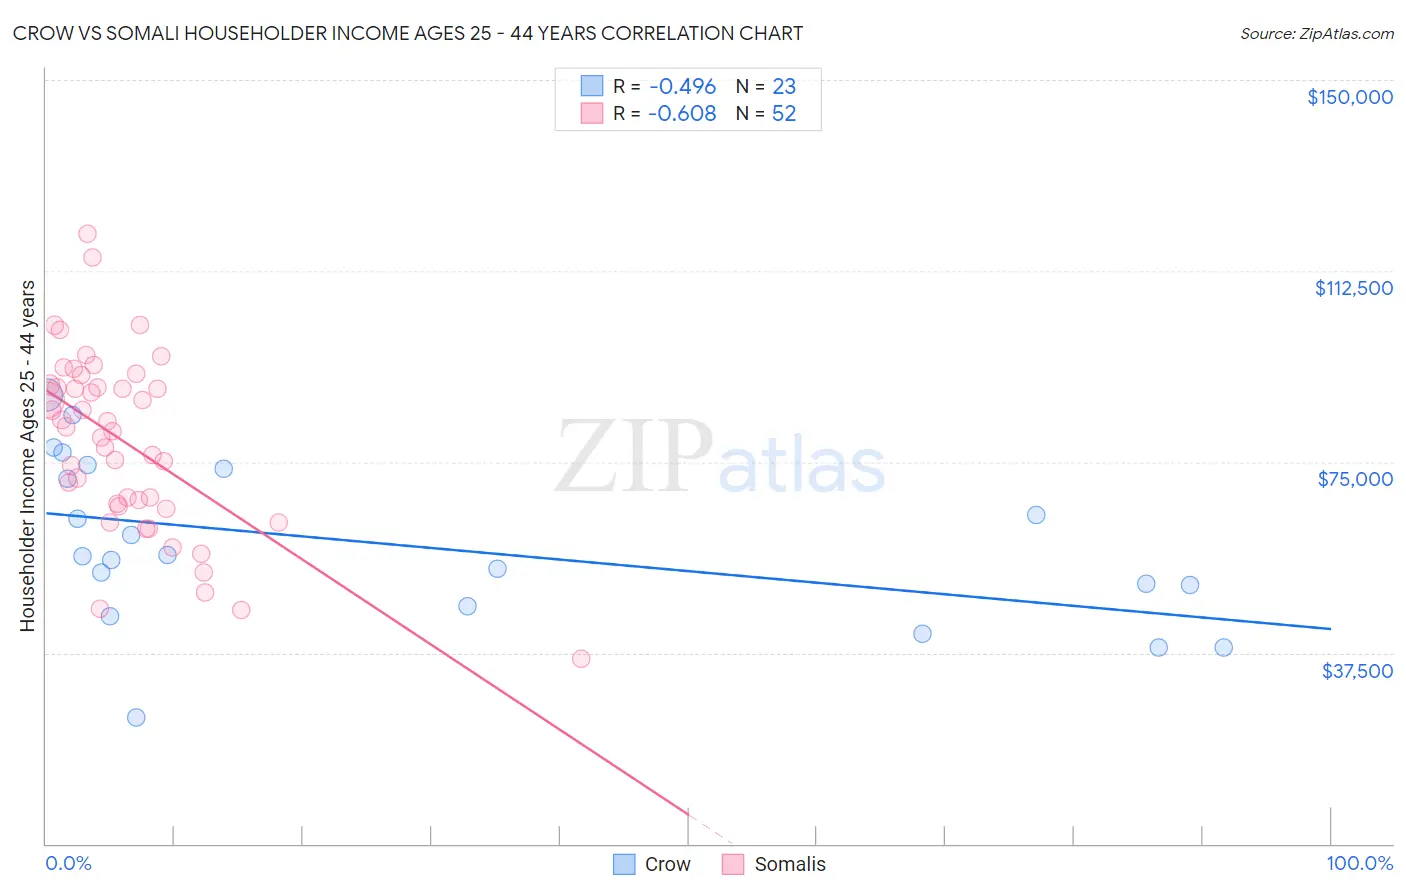
Crow vs Somali Householder Income Ages 25 - 44 years Correlation Chart
The statistical analysis conducted on geographies consisting of 59,146,182 people shows a moderate negative correlation between the proportion of Crow and household income with householder between the ages 25 and 44 in the United States with a correlation coefficient (R) of -0.496 and weighted average of $71,337. Similarly, the statistical analysis conducted on geographies consisting of 99,259,991 people shows a significant negative correlation between the proportion of Somalis and household income with householder between the ages 25 and 44 in the United States with a correlation coefficient (R) of -0.608 and weighted average of $83,752, a difference of 17.4%.
Householder Income Ages 25 - 44 years Correlation Summary
| Measurement | Crow | Somali |
| Minimum | $24,750 | $36,409 |
| Maximum | $88,221 | $119,737 |
| Range | $63,471 | $83,328 |
| Mean | $58,648 | $78,789 |
| Median | $56,586 | $81,501 |
| Interquartile 25% (IQ1) | $46,651 | $66,569 |
| Interquartile 75% (IQ3) | $73,750 | $89,819 |
| Interquartile Range (IQR) | $27,099 | $23,250 |
| Standard Deviation (Sample) | $16,111 | $17,508 |
| Standard Deviation (Population) | $15,756 | $17,339 |
Similar Demographics by Householder Income Ages 25 - 44 years
Demographics Similar to Crow by Householder Income Ages 25 - 44 years
In terms of householder income ages 25 - 44 years, the demographic groups most similar to Crow are Arapaho ($71,697, a difference of 0.50%), Immigrants from Congo ($72,178, a difference of 1.2%), Yuman ($72,956, a difference of 2.3%), Immigrants from Yemen ($73,043, a difference of 2.4%), and Black/African American ($73,370, a difference of 2.9%).
| Demographics | Rating | Rank | Householder Income Ages 25 - 44 years |
| Hopi | 0.0 /100 | #333 | Tragic $75,002 |
| Creek | 0.0 /100 | #334 | Tragic $74,847 |
| Kiowa | 0.0 /100 | #335 | Tragic $74,776 |
| Yup'ik | 0.0 /100 | #336 | Tragic $73,688 |
| Blacks/African Americans | 0.0 /100 | #337 | Tragic $73,370 |
| Immigrants | Yemen | 0.0 /100 | #338 | Tragic $73,043 |
| Yuman | 0.0 /100 | #339 | Tragic $72,956 |
| Immigrants | Congo | 0.0 /100 | #340 | Tragic $72,178 |
| Arapaho | 0.0 /100 | #341 | Tragic $71,697 |
| Crow | 0.0 /100 | #342 | Tragic $71,337 |
| Tohono O'odham | 0.0 /100 | #343 | Tragic $69,068 |
| Pueblo | 0.0 /100 | #344 | Tragic $68,910 |
| Navajo | 0.0 /100 | #345 | Tragic $66,529 |
| Puerto Ricans | 0.0 /100 | #346 | Tragic $65,996 |
| Lumbee | 0.0 /100 | #347 | Tragic $60,305 |
Demographics Similar to Somalis by Householder Income Ages 25 - 44 years
In terms of householder income ages 25 - 44 years, the demographic groups most similar to Somalis are Spanish American ($83,722, a difference of 0.040%), Iroquois ($83,682, a difference of 0.080%), Marshallese ($83,575, a difference of 0.21%), Jamaican ($83,933, a difference of 0.22%), and Spanish American Indian ($84,085, a difference of 0.40%).
| Demographics | Rating | Rank | Householder Income Ages 25 - 44 years |
| Osage | 0.4 /100 | #264 | Tragic $84,461 |
| Sudanese | 0.4 /100 | #265 | Tragic $84,401 |
| Immigrants | Cabo Verde | 0.3 /100 | #266 | Tragic $84,304 |
| Hmong | 0.3 /100 | #267 | Tragic $84,258 |
| Sub-Saharan Africans | 0.3 /100 | #268 | Tragic $84,235 |
| Spanish American Indians | 0.3 /100 | #269 | Tragic $84,085 |
| Jamaicans | 0.3 /100 | #270 | Tragic $83,933 |
| Somalis | 0.2 /100 | #271 | Tragic $83,752 |
| Spanish Americans | 0.2 /100 | #272 | Tragic $83,722 |
| Iroquois | 0.2 /100 | #273 | Tragic $83,682 |
| Marshallese | 0.2 /100 | #274 | Tragic $83,575 |
| Immigrants | Jamaica | 0.2 /100 | #275 | Tragic $83,298 |
| Immigrants | Belize | 0.2 /100 | #276 | Tragic $83,141 |
| Paiute | 0.2 /100 | #277 | Tragic $82,984 |
| Senegalese | 0.2 /100 | #278 | Tragic $82,852 |