Immigrants from El Salvador vs Immigrants from Syria Single Male Poverty
COMPARE
Immigrants from El Salvador
Immigrants from Syria
Single Male Poverty
Single Male Poverty Comparison
Immigrants from El Salvador
Immigrants from Syria
12.6%
SINGLE MALE POVERTY
80.0/ 100
METRIC RATING
138th/ 347
METRIC RANK
12.4%
SINGLE MALE POVERTY
91.2/ 100
METRIC RATING
116th/ 347
METRIC RANK
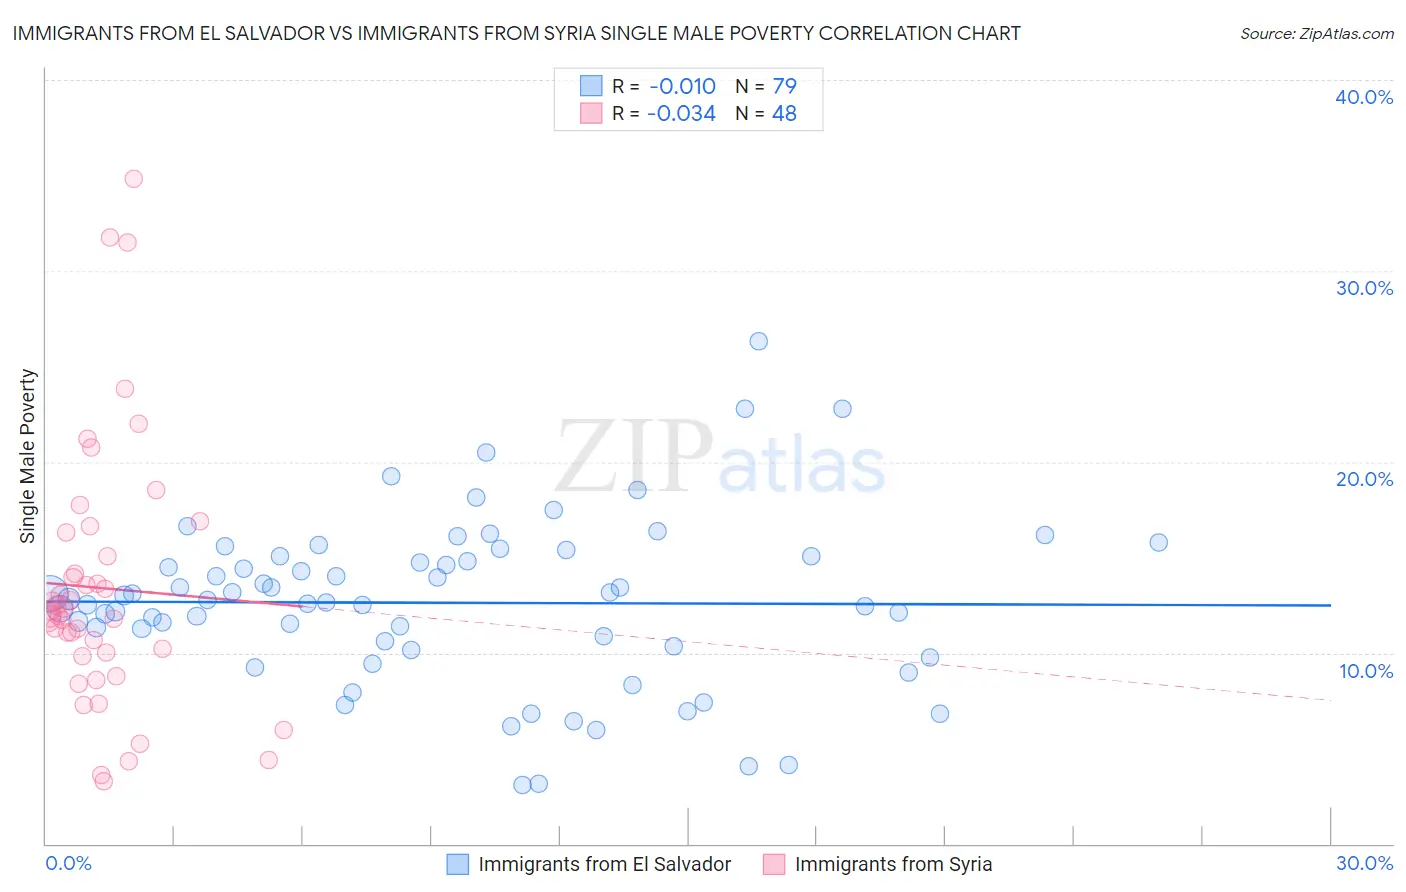
Immigrants from El Salvador vs Immigrants from Syria Single Male Poverty Correlation Chart
The statistical analysis conducted on geographies consisting of 325,623,225 people shows no correlation between the proportion of Immigrants from El Salvador and poverty level among single males in the United States with a correlation coefficient (R) of -0.010 and weighted average of 12.6%. Similarly, the statistical analysis conducted on geographies consisting of 162,303,345 people shows no correlation between the proportion of Immigrants from Syria and poverty level among single males in the United States with a correlation coefficient (R) of -0.034 and weighted average of 12.4%, a difference of 1.3%.
Single Male Poverty Correlation Summary
| Measurement | Immigrants from El Salvador | Immigrants from Syria |
| Minimum | 3.1% | 3.3% |
| Maximum | 26.3% | 34.8% |
| Range | 23.3% | 31.5% |
| Mean | 12.6% | 13.4% |
| Median | 12.8% | 12.1% |
| Interquartile 25% (IQ1) | 10.3% | 9.9% |
| Interquartile 75% (IQ3) | 15.1% | 15.7% |
| Interquartile Range (IQR) | 4.7% | 5.8% |
| Standard Deviation (Sample) | 4.3% | 6.8% |
| Standard Deviation (Population) | 4.3% | 6.8% |
Similar Demographics by Single Male Poverty
Demographics Similar to Immigrants from El Salvador by Single Male Poverty
In terms of single male poverty, the demographic groups most similar to Immigrants from El Salvador are Cuban (12.6%, a difference of 0.010%), Ukrainian (12.6%, a difference of 0.060%), Immigrants from Costa Rica (12.5%, a difference of 0.16%), Immigrants from Austria (12.5%, a difference of 0.16%), and Immigrants from Zimbabwe (12.6%, a difference of 0.16%).
| Demographics | Rating | Rank | Single Male Poverty |
| Immigrants | Northern Europe | 83.7 /100 | #131 | Excellent 12.5% |
| Salvadorans | 83.7 /100 | #132 | Excellent 12.5% |
| Immigrants | Western Asia | 83.4 /100 | #133 | Excellent 12.5% |
| Immigrants | Ecuador | 82.1 /100 | #134 | Excellent 12.5% |
| Immigrants | Costa Rica | 81.9 /100 | #135 | Excellent 12.5% |
| Immigrants | Austria | 81.9 /100 | #136 | Excellent 12.5% |
| Ukrainians | 80.7 /100 | #137 | Excellent 12.6% |
| Immigrants | El Salvador | 80.0 /100 | #138 | Excellent 12.6% |
| Cubans | 79.9 /100 | #139 | Good 12.6% |
| Immigrants | Zimbabwe | 78.0 /100 | #140 | Good 12.6% |
| Okinawans | 75.9 /100 | #141 | Good 12.6% |
| Immigrants | Uganda | 75.9 /100 | #142 | Good 12.6% |
| Immigrants | France | 75.8 /100 | #143 | Good 12.6% |
| Hawaiians | 75.1 /100 | #144 | Good 12.6% |
| Immigrants | Lebanon | 75.0 /100 | #145 | Good 12.6% |
Demographics Similar to Immigrants from Syria by Single Male Poverty
In terms of single male poverty, the demographic groups most similar to Immigrants from Syria are Immigrants from Oceania (12.4%, a difference of 0.010%), Immigrants from Southern Europe (12.4%, a difference of 0.060%), Albanian (12.4%, a difference of 0.11%), Immigrants from Albania (12.4%, a difference of 0.14%), and Nicaraguan (12.4%, a difference of 0.16%).
| Demographics | Rating | Rank | Single Male Poverty |
| Ugandans | 94.5 /100 | #109 | Exceptional 12.3% |
| Immigrants | Portugal | 93.6 /100 | #110 | Exceptional 12.3% |
| Immigrants | North Macedonia | 93.6 /100 | #111 | Exceptional 12.3% |
| Kenyans | 93.3 /100 | #112 | Exceptional 12.4% |
| Pakistanis | 92.4 /100 | #113 | Exceptional 12.4% |
| Nicaraguans | 92.1 /100 | #114 | Exceptional 12.4% |
| Immigrants | Southern Europe | 91.5 /100 | #115 | Exceptional 12.4% |
| Immigrants | Syria | 91.2 /100 | #116 | Exceptional 12.4% |
| Immigrants | Oceania | 91.1 /100 | #117 | Exceptional 12.4% |
| Albanians | 90.6 /100 | #118 | Exceptional 12.4% |
| Immigrants | Albania | 90.3 /100 | #119 | Exceptional 12.4% |
| Venezuelans | 89.4 /100 | #120 | Excellent 12.4% |
| Icelanders | 88.2 /100 | #121 | Excellent 12.5% |
| Serbians | 87.9 /100 | #122 | Excellent 12.5% |
| Immigrants | Kenya | 87.6 /100 | #123 | Excellent 12.5% |