Immigrants from West Indies vs Immigrants from Syria Single Male Poverty
COMPARE
Immigrants from West Indies
Immigrants from Syria
Single Male Poverty
Single Male Poverty Comparison
Immigrants from West Indies
Immigrants from Syria
12.9%
SINGLE MALE POVERTY
33.0/ 100
METRIC RATING
183rd/ 347
METRIC RANK
12.4%
SINGLE MALE POVERTY
91.2/ 100
METRIC RATING
116th/ 347
METRIC RANK
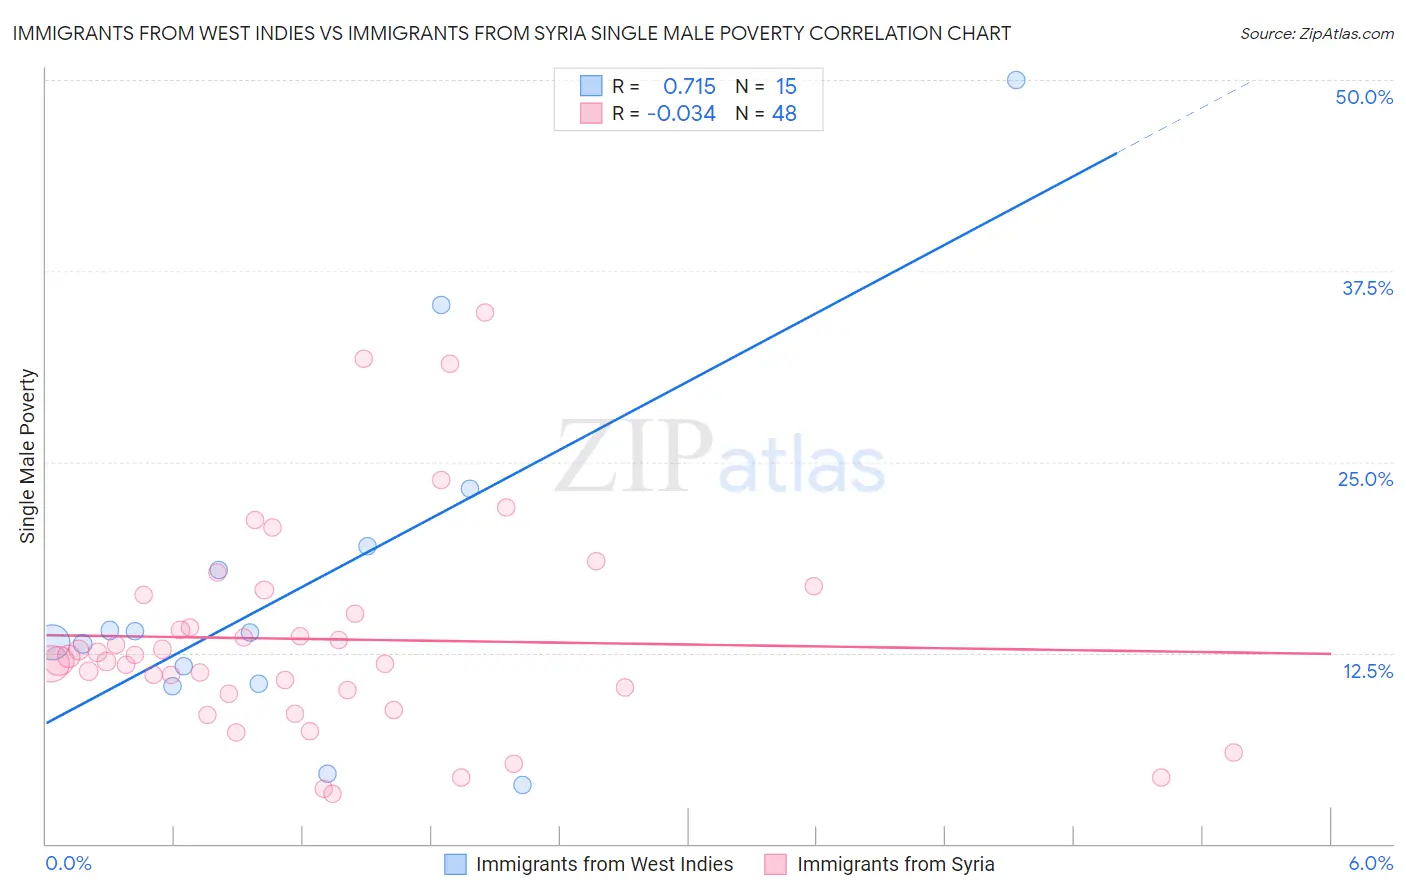
Immigrants from West Indies vs Immigrants from Syria Single Male Poverty Correlation Chart
The statistical analysis conducted on geographies consisting of 70,729,922 people shows a strong positive correlation between the proportion of Immigrants from West Indies and poverty level among single males in the United States with a correlation coefficient (R) of 0.715 and weighted average of 12.9%. Similarly, the statistical analysis conducted on geographies consisting of 162,303,345 people shows no correlation between the proportion of Immigrants from Syria and poverty level among single males in the United States with a correlation coefficient (R) of -0.034 and weighted average of 12.4%, a difference of 4.1%.
Single Male Poverty Correlation Summary
| Measurement | Immigrants from West Indies | Immigrants from Syria |
| Minimum | 3.8% | 3.3% |
| Maximum | 50.0% | 34.8% |
| Range | 46.2% | 31.5% |
| Mean | 17.0% | 13.4% |
| Median | 13.8% | 12.1% |
| Interquartile 25% (IQ1) | 10.5% | 9.9% |
| Interquartile 75% (IQ3) | 19.5% | 15.7% |
| Interquartile Range (IQR) | 9.0% | 5.8% |
| Standard Deviation (Sample) | 11.9% | 6.8% |
| Standard Deviation (Population) | 11.5% | 6.8% |
Similar Demographics by Single Male Poverty
Demographics Similar to Immigrants from West Indies by Single Male Poverty
In terms of single male poverty, the demographic groups most similar to Immigrants from West Indies are Immigrants from Trinidad and Tobago (12.9%, a difference of 0.030%), Norwegian (12.9%, a difference of 0.060%), Nigerian (12.9%, a difference of 0.060%), Immigrants from Kuwait (12.9%, a difference of 0.060%), and Macedonian (12.9%, a difference of 0.090%).
| Demographics | Rating | Rank | Single Male Poverty |
| Syrians | 48.4 /100 | #176 | Average 12.8% |
| Immigrants | Canada | 44.8 /100 | #177 | Average 12.8% |
| Immigrants | Switzerland | 43.1 /100 | #178 | Average 12.8% |
| Israelis | 41.0 /100 | #179 | Average 12.9% |
| Immigrants | North America | 37.7 /100 | #180 | Fair 12.9% |
| Panamanians | 37.6 /100 | #181 | Fair 12.9% |
| Moroccans | 36.8 /100 | #182 | Fair 12.9% |
| Immigrants | West Indies | 33.0 /100 | #183 | Fair 12.9% |
| Immigrants | Trinidad and Tobago | 32.5 /100 | #184 | Fair 12.9% |
| Norwegians | 32.0 /100 | #185 | Fair 12.9% |
| Nigerians | 31.9 /100 | #186 | Fair 12.9% |
| Immigrants | Kuwait | 31.9 /100 | #187 | Fair 12.9% |
| Macedonians | 31.5 /100 | #188 | Fair 12.9% |
| Portuguese | 30.2 /100 | #189 | Fair 12.9% |
| Arabs | 27.0 /100 | #190 | Fair 13.0% |
Demographics Similar to Immigrants from Syria by Single Male Poverty
In terms of single male poverty, the demographic groups most similar to Immigrants from Syria are Immigrants from Oceania (12.4%, a difference of 0.010%), Immigrants from Southern Europe (12.4%, a difference of 0.060%), Albanian (12.4%, a difference of 0.11%), Immigrants from Albania (12.4%, a difference of 0.14%), and Nicaraguan (12.4%, a difference of 0.16%).
| Demographics | Rating | Rank | Single Male Poverty |
| Ugandans | 94.5 /100 | #109 | Exceptional 12.3% |
| Immigrants | Portugal | 93.6 /100 | #110 | Exceptional 12.3% |
| Immigrants | North Macedonia | 93.6 /100 | #111 | Exceptional 12.3% |
| Kenyans | 93.3 /100 | #112 | Exceptional 12.4% |
| Pakistanis | 92.4 /100 | #113 | Exceptional 12.4% |
| Nicaraguans | 92.1 /100 | #114 | Exceptional 12.4% |
| Immigrants | Southern Europe | 91.5 /100 | #115 | Exceptional 12.4% |
| Immigrants | Syria | 91.2 /100 | #116 | Exceptional 12.4% |
| Immigrants | Oceania | 91.1 /100 | #117 | Exceptional 12.4% |
| Albanians | 90.6 /100 | #118 | Exceptional 12.4% |
| Immigrants | Albania | 90.3 /100 | #119 | Exceptional 12.4% |
| Venezuelans | 89.4 /100 | #120 | Excellent 12.4% |
| Icelanders | 88.2 /100 | #121 | Excellent 12.5% |
| Serbians | 87.9 /100 | #122 | Excellent 12.5% |
| Immigrants | Kenya | 87.6 /100 | #123 | Excellent 12.5% |