Crow vs Immigrants from the Azores Single Mother Poverty
COMPARE
Crow
Immigrants from the Azores
Single Mother Poverty
Single Mother Poverty Comparison
Crow
Immigrants from the Azores
38.6%
SINGLE MOTHER POVERTY
0.0/ 100
METRIC RATING
339th/ 347
METRIC RANK
32.2%
SINGLE MOTHER POVERTY
0.0/ 100
METRIC RATING
282nd/ 347
METRIC RANK
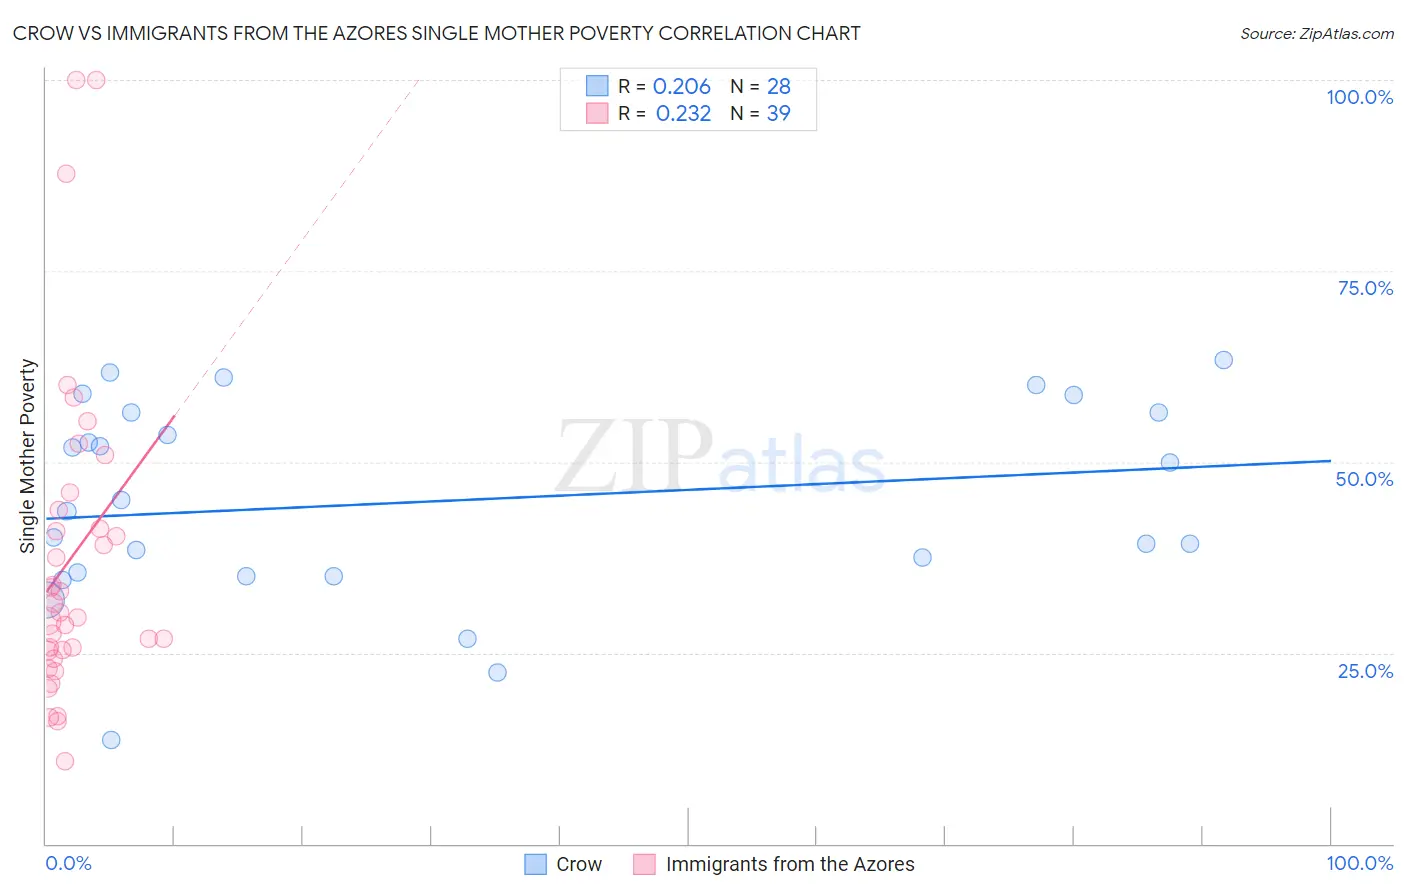
Crow vs Immigrants from the Azores Single Mother Poverty Correlation Chart
The statistical analysis conducted on geographies consisting of 58,942,445 people shows a weak positive correlation between the proportion of Crow and poverty level among single mothers in the United States with a correlation coefficient (R) of 0.206 and weighted average of 38.6%. Similarly, the statistical analysis conducted on geographies consisting of 45,777,627 people shows a weak positive correlation between the proportion of Immigrants from the Azores and poverty level among single mothers in the United States with a correlation coefficient (R) of 0.232 and weighted average of 32.2%, a difference of 19.9%.
Single Mother Poverty Correlation Summary
| Measurement | Crow | Immigrants from the Azores |
| Minimum | 13.6% | 10.8% |
| Maximum | 63.4% | 100.0% |
| Range | 49.8% | 89.2% |
| Mean | 44.8% | 37.4% |
| Median | 44.3% | 30.3% |
| Interquartile 25% (IQ1) | 35.2% | 25.3% |
| Interquartile 75% (IQ3) | 56.5% | 43.7% |
| Interquartile Range (IQR) | 21.3% | 18.5% |
| Standard Deviation (Sample) | 13.0% | 20.9% |
| Standard Deviation (Population) | 12.8% | 20.6% |
Similar Demographics by Single Mother Poverty
Demographics Similar to Crow by Single Mother Poverty
In terms of single mother poverty, the demographic groups most similar to Crow are Pima (38.6%, a difference of 0.090%), Immigrants from Yemen (38.5%, a difference of 0.30%), Cheyenne (38.5%, a difference of 0.34%), Sioux (38.8%, a difference of 0.40%), and Colville (39.3%, a difference of 1.7%).
| Demographics | Rating | Rank | Single Mother Poverty |
| Dutch West Indians | 0.0 /100 | #332 | Tragic 36.8% |
| Menominee | 0.0 /100 | #333 | Tragic 37.1% |
| Pueblo | 0.0 /100 | #334 | Tragic 37.2% |
| Yuman | 0.0 /100 | #335 | Tragic 37.8% |
| Cheyenne | 0.0 /100 | #336 | Tragic 38.5% |
| Immigrants | Yemen | 0.0 /100 | #337 | Tragic 38.5% |
| Pima | 0.0 /100 | #338 | Tragic 38.6% |
| Crow | 0.0 /100 | #339 | Tragic 38.6% |
| Sioux | 0.0 /100 | #340 | Tragic 38.8% |
| Colville | 0.0 /100 | #341 | Tragic 39.3% |
| Navajo | 0.0 /100 | #342 | Tragic 40.2% |
| Cajuns | 0.0 /100 | #343 | Tragic 40.3% |
| Tohono O'odham | 0.0 /100 | #344 | Tragic 43.0% |
| Lumbee | 0.0 /100 | #345 | Tragic 43.2% |
| Houma | 0.0 /100 | #346 | Tragic 43.5% |
Demographics Similar to Immigrants from the Azores by Single Mother Poverty
In terms of single mother poverty, the demographic groups most similar to Immigrants from the Azores are Cree (32.2%, a difference of 0.11%), Nonimmigrants (32.2%, a difference of 0.14%), Spanish American (32.3%, a difference of 0.25%), Marshallese (32.1%, a difference of 0.36%), and Indonesian (32.4%, a difference of 0.55%).
| Demographics | Rating | Rank | Single Mother Poverty |
| Central Americans | 0.1 /100 | #275 | Tragic 31.8% |
| Delaware | 0.0 /100 | #276 | Tragic 31.8% |
| Mexican American Indians | 0.0 /100 | #277 | Tragic 31.9% |
| Immigrants | Zaire | 0.0 /100 | #278 | Tragic 32.0% |
| Marshallese | 0.0 /100 | #279 | Tragic 32.1% |
| Immigrants | Nonimmigrants | 0.0 /100 | #280 | Tragic 32.2% |
| Cree | 0.0 /100 | #281 | Tragic 32.2% |
| Immigrants | Azores | 0.0 /100 | #282 | Tragic 32.2% |
| Spanish Americans | 0.0 /100 | #283 | Tragic 32.3% |
| Indonesians | 0.0 /100 | #284 | Tragic 32.4% |
| Immigrants | Latin America | 0.0 /100 | #285 | Tragic 32.4% |
| Yup'ik | 0.0 /100 | #286 | Tragic 32.5% |
| Immigrants | Dominica | 0.0 /100 | #287 | Tragic 32.5% |
| Somalis | 0.0 /100 | #288 | Tragic 32.6% |
| U.S. Virgin Islanders | 0.0 /100 | #289 | Tragic 32.6% |