Immigrants from Bangladesh vs Immigrants from the Azores Single Mother Poverty
COMPARE
Immigrants from Bangladesh
Immigrants from the Azores
Single Mother Poverty
Single Mother Poverty Comparison
Immigrants from Bangladesh
Immigrants from the Azores
31.1%
SINGLE MOTHER POVERTY
0.4/ 100
METRIC RATING
259th/ 347
METRIC RANK
32.2%
SINGLE MOTHER POVERTY
0.0/ 100
METRIC RATING
282nd/ 347
METRIC RANK
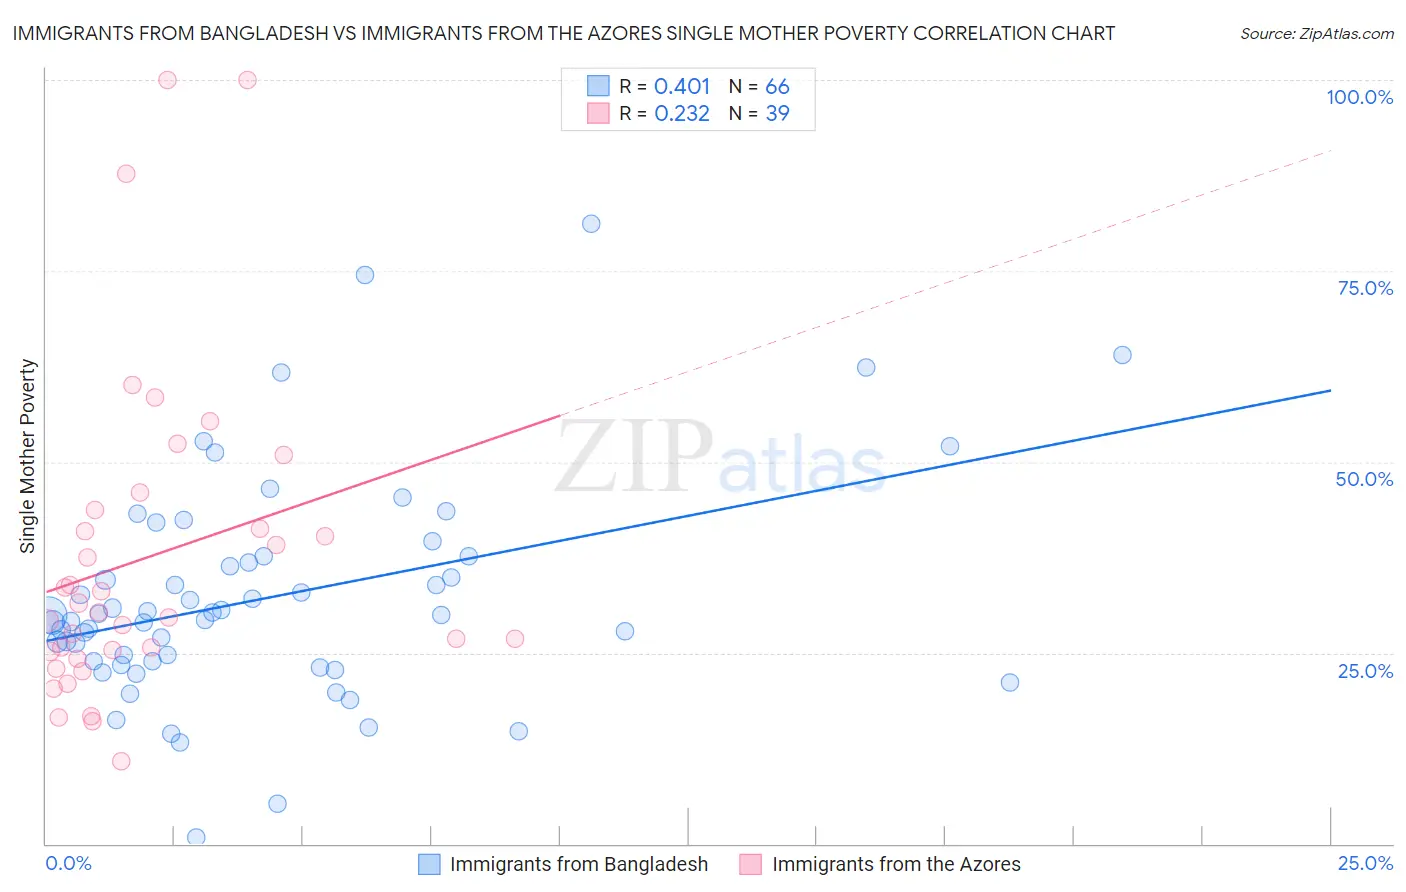
Immigrants from Bangladesh vs Immigrants from the Azores Single Mother Poverty Correlation Chart
The statistical analysis conducted on geographies consisting of 201,175,153 people shows a moderate positive correlation between the proportion of Immigrants from Bangladesh and poverty level among single mothers in the United States with a correlation coefficient (R) of 0.401 and weighted average of 31.1%. Similarly, the statistical analysis conducted on geographies consisting of 45,777,627 people shows a weak positive correlation between the proportion of Immigrants from the Azores and poverty level among single mothers in the United States with a correlation coefficient (R) of 0.232 and weighted average of 32.2%, a difference of 3.5%.
Single Mother Poverty Correlation Summary
| Measurement | Immigrants from Bangladesh | Immigrants from the Azores |
| Minimum | 0.77% | 10.8% |
| Maximum | 81.2% | 100.0% |
| Range | 80.5% | 89.2% |
| Mean | 32.3% | 37.4% |
| Median | 29.9% | 30.3% |
| Interquartile 25% (IQ1) | 23.8% | 25.3% |
| Interquartile 75% (IQ3) | 37.6% | 43.7% |
| Interquartile Range (IQR) | 13.7% | 18.5% |
| Standard Deviation (Sample) | 14.7% | 20.9% |
| Standard Deviation (Population) | 14.5% | 20.6% |
Similar Demographics by Single Mother Poverty
Demographics Similar to Immigrants from Bangladesh by Single Mother Poverty
In terms of single mother poverty, the demographic groups most similar to Immigrants from Bangladesh are Immigrants from Caribbean (31.1%, a difference of 0.030%), Immigrants from Bahamas (31.1%, a difference of 0.12%), Immigrants from West Indies (31.1%, a difference of 0.16%), White/Caucasian (31.2%, a difference of 0.16%), and Immigrants from El Salvador (31.2%, a difference of 0.23%).
| Demographics | Rating | Rank | Single Mother Poverty |
| Alaska Natives | 0.6 /100 | #252 | Tragic 30.9% |
| Celtics | 0.6 /100 | #253 | Tragic 30.9% |
| Senegalese | 0.5 /100 | #254 | Tragic 31.0% |
| Belizeans | 0.5 /100 | #255 | Tragic 31.0% |
| Immigrants | West Indies | 0.4 /100 | #256 | Tragic 31.1% |
| Immigrants | Bahamas | 0.4 /100 | #257 | Tragic 31.1% |
| Immigrants | Caribbean | 0.4 /100 | #258 | Tragic 31.1% |
| Immigrants | Bangladesh | 0.4 /100 | #259 | Tragic 31.1% |
| Whites/Caucasians | 0.3 /100 | #260 | Tragic 31.2% |
| Immigrants | El Salvador | 0.3 /100 | #261 | Tragic 31.2% |
| Hmong | 0.3 /100 | #262 | Tragic 31.2% |
| Bahamians | 0.2 /100 | #263 | Tragic 31.3% |
| Immigrants | Ecuador | 0.2 /100 | #264 | Tragic 31.3% |
| German Russians | 0.2 /100 | #265 | Tragic 31.3% |
| Sub-Saharan Africans | 0.2 /100 | #266 | Tragic 31.4% |
Demographics Similar to Immigrants from the Azores by Single Mother Poverty
In terms of single mother poverty, the demographic groups most similar to Immigrants from the Azores are Cree (32.2%, a difference of 0.11%), Nonimmigrants (32.2%, a difference of 0.14%), Spanish American (32.3%, a difference of 0.25%), Marshallese (32.1%, a difference of 0.36%), and Indonesian (32.4%, a difference of 0.55%).
| Demographics | Rating | Rank | Single Mother Poverty |
| Central Americans | 0.1 /100 | #275 | Tragic 31.8% |
| Delaware | 0.0 /100 | #276 | Tragic 31.8% |
| Mexican American Indians | 0.0 /100 | #277 | Tragic 31.9% |
| Immigrants | Zaire | 0.0 /100 | #278 | Tragic 32.0% |
| Marshallese | 0.0 /100 | #279 | Tragic 32.1% |
| Immigrants | Nonimmigrants | 0.0 /100 | #280 | Tragic 32.2% |
| Cree | 0.0 /100 | #281 | Tragic 32.2% |
| Immigrants | Azores | 0.0 /100 | #282 | Tragic 32.2% |
| Spanish Americans | 0.0 /100 | #283 | Tragic 32.3% |
| Indonesians | 0.0 /100 | #284 | Tragic 32.4% |
| Immigrants | Latin America | 0.0 /100 | #285 | Tragic 32.4% |
| Yup'ik | 0.0 /100 | #286 | Tragic 32.5% |
| Immigrants | Dominica | 0.0 /100 | #287 | Tragic 32.5% |
| Somalis | 0.0 /100 | #288 | Tragic 32.6% |
| U.S. Virgin Islanders | 0.0 /100 | #289 | Tragic 32.6% |