Palestinian vs Immigrants from the Azores Single Mother Poverty
COMPARE
Palestinian
Immigrants from the Azores
Single Mother Poverty
Single Mother Poverty Comparison
Palestinians
Immigrants from the Azores
27.2%
SINGLE MOTHER POVERTY
99.7/ 100
METRIC RATING
57th/ 347
METRIC RANK
32.2%
SINGLE MOTHER POVERTY
0.0/ 100
METRIC RATING
282nd/ 347
METRIC RANK
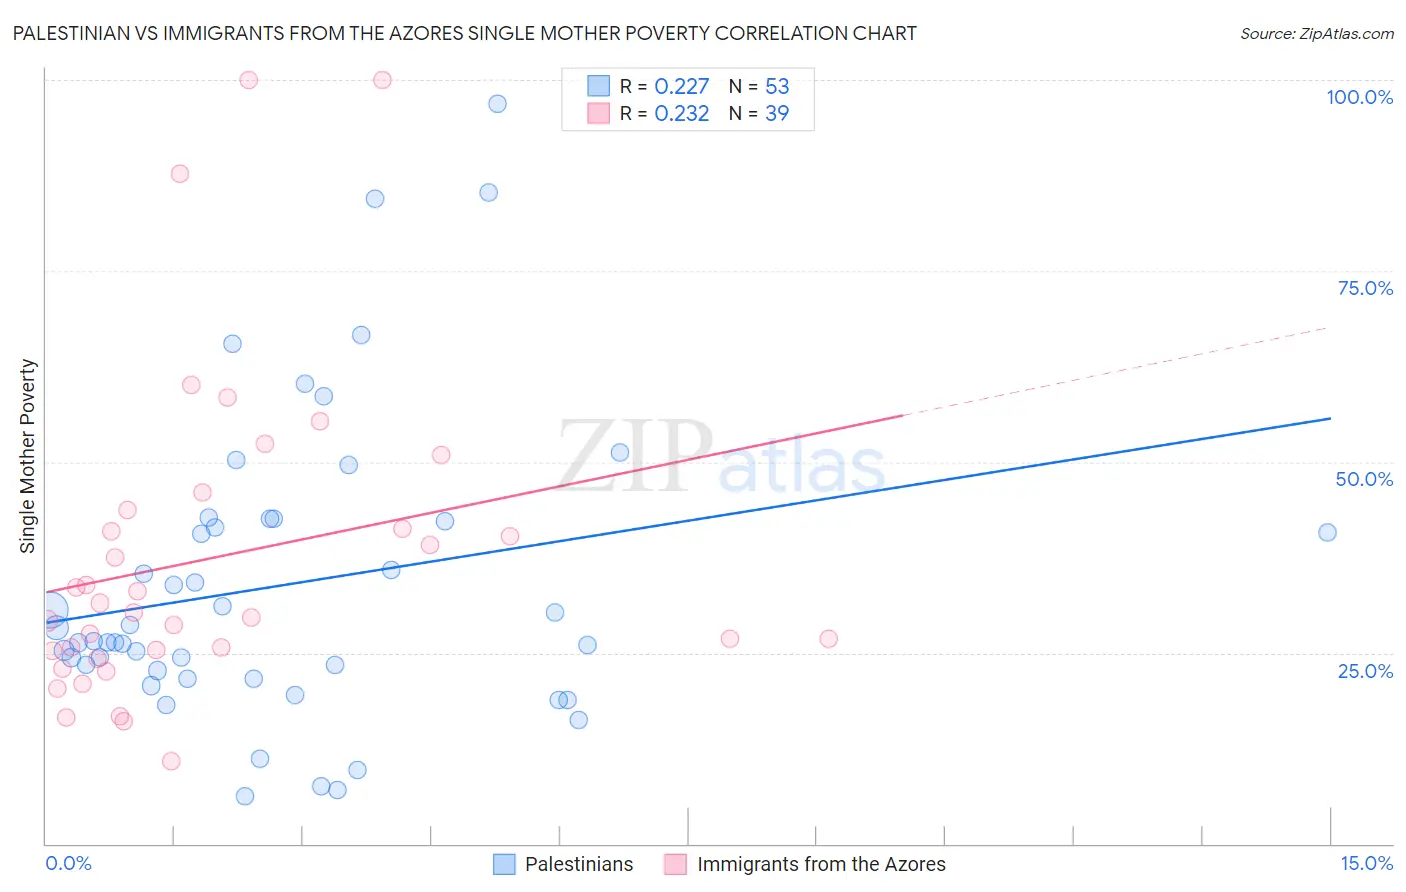
Palestinian vs Immigrants from the Azores Single Mother Poverty Correlation Chart
The statistical analysis conducted on geographies consisting of 213,948,713 people shows a weak positive correlation between the proportion of Palestinians and poverty level among single mothers in the United States with a correlation coefficient (R) of 0.227 and weighted average of 27.2%. Similarly, the statistical analysis conducted on geographies consisting of 45,777,627 people shows a weak positive correlation between the proportion of Immigrants from the Azores and poverty level among single mothers in the United States with a correlation coefficient (R) of 0.232 and weighted average of 32.2%, a difference of 18.6%.
Single Mother Poverty Correlation Summary
| Measurement | Palestinian | Immigrants from the Azores |
| Minimum | 6.2% | 10.8% |
| Maximum | 96.9% | 100.0% |
| Range | 90.7% | 89.2% |
| Mean | 33.9% | 37.4% |
| Median | 26.6% | 30.3% |
| Interquartile 25% (IQ1) | 22.2% | 25.3% |
| Interquartile 75% (IQ3) | 42.4% | 43.7% |
| Interquartile Range (IQR) | 20.3% | 18.5% |
| Standard Deviation (Sample) | 19.6% | 20.9% |
| Standard Deviation (Population) | 19.4% | 20.6% |
Similar Demographics by Single Mother Poverty
Demographics Similar to Palestinians by Single Mother Poverty
In terms of single mother poverty, the demographic groups most similar to Palestinians are Immigrants from Romania (27.2%, a difference of 0.030%), Immigrants from Egypt (27.1%, a difference of 0.080%), Immigrants from Bulgaria (27.1%, a difference of 0.11%), Immigrants from Jordan (27.1%, a difference of 0.14%), and Argentinean (27.2%, a difference of 0.15%).
| Demographics | Rating | Rank | Single Mother Poverty |
| Laotians | 99.8 /100 | #50 | Exceptional 27.0% |
| Immigrants | Argentina | 99.7 /100 | #51 | Exceptional 27.1% |
| Immigrants | South Eastern Asia | 99.7 /100 | #52 | Exceptional 27.1% |
| Immigrants | Jordan | 99.7 /100 | #53 | Exceptional 27.1% |
| Immigrants | Bulgaria | 99.7 /100 | #54 | Exceptional 27.1% |
| Immigrants | Egypt | 99.7 /100 | #55 | Exceptional 27.1% |
| Immigrants | Romania | 99.7 /100 | #56 | Exceptional 27.2% |
| Palestinians | 99.7 /100 | #57 | Exceptional 27.2% |
| Argentineans | 99.6 /100 | #58 | Exceptional 27.2% |
| Paraguayans | 99.6 /100 | #59 | Exceptional 27.2% |
| Eastern Europeans | 99.6 /100 | #60 | Exceptional 27.2% |
| Immigrants | Eastern Europe | 99.6 /100 | #61 | Exceptional 27.2% |
| Immigrants | Malaysia | 99.5 /100 | #62 | Exceptional 27.3% |
| Immigrants | Northern Europe | 99.5 /100 | #63 | Exceptional 27.3% |
| Russians | 99.5 /100 | #64 | Exceptional 27.3% |
Demographics Similar to Immigrants from the Azores by Single Mother Poverty
In terms of single mother poverty, the demographic groups most similar to Immigrants from the Azores are Cree (32.2%, a difference of 0.11%), Nonimmigrants (32.2%, a difference of 0.14%), Spanish American (32.3%, a difference of 0.25%), Marshallese (32.1%, a difference of 0.36%), and Indonesian (32.4%, a difference of 0.55%).
| Demographics | Rating | Rank | Single Mother Poverty |
| Central Americans | 0.1 /100 | #275 | Tragic 31.8% |
| Delaware | 0.0 /100 | #276 | Tragic 31.8% |
| Mexican American Indians | 0.0 /100 | #277 | Tragic 31.9% |
| Immigrants | Zaire | 0.0 /100 | #278 | Tragic 32.0% |
| Marshallese | 0.0 /100 | #279 | Tragic 32.1% |
| Immigrants | Nonimmigrants | 0.0 /100 | #280 | Tragic 32.2% |
| Cree | 0.0 /100 | #281 | Tragic 32.2% |
| Immigrants | Azores | 0.0 /100 | #282 | Tragic 32.2% |
| Spanish Americans | 0.0 /100 | #283 | Tragic 32.3% |
| Indonesians | 0.0 /100 | #284 | Tragic 32.4% |
| Immigrants | Latin America | 0.0 /100 | #285 | Tragic 32.4% |
| Yup'ik | 0.0 /100 | #286 | Tragic 32.5% |
| Immigrants | Dominica | 0.0 /100 | #287 | Tragic 32.5% |
| Somalis | 0.0 /100 | #288 | Tragic 32.6% |
| U.S. Virgin Islanders | 0.0 /100 | #289 | Tragic 32.6% |