Creek vs Samoan Receiving Food Stamps
COMPARE
Creek
Samoan
Receiving Food Stamps
Receiving Food Stamps Comparison
Creek
Samoans
14.1%
RECEIVING FOOD STAMPS
0.3/ 100
METRIC RATING
259th/ 347
METRIC RANK
12.1%
RECEIVING FOOD STAMPS
31.0/ 100
METRIC RATING
192nd/ 347
METRIC RANK
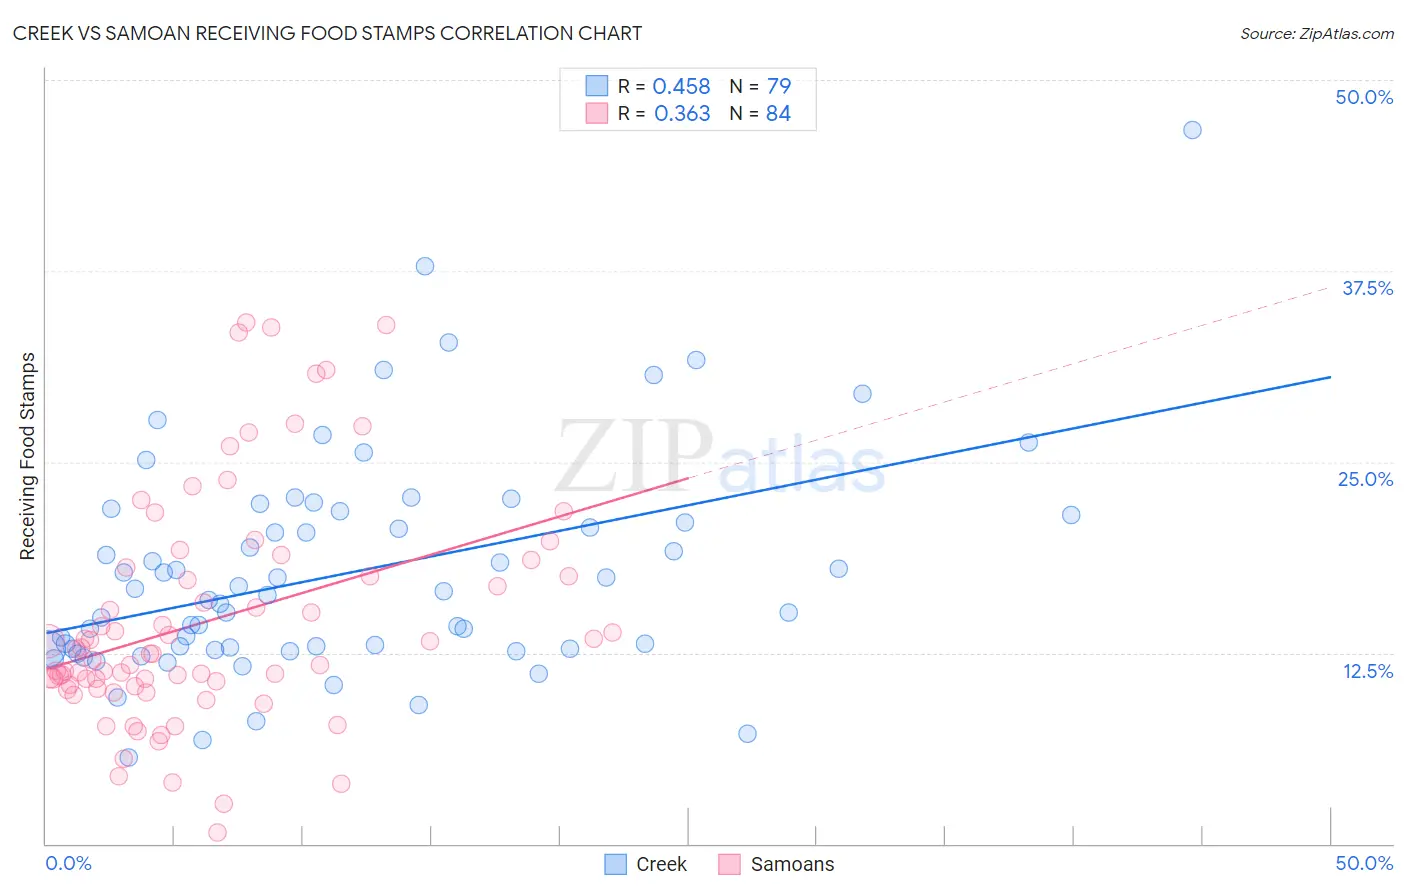
Creek vs Samoan Receiving Food Stamps Correlation Chart
The statistical analysis conducted on geographies consisting of 178,321,900 people shows a moderate positive correlation between the proportion of Creek and percentage of population receiving government assistance and/or food stamps in the United States with a correlation coefficient (R) of 0.458 and weighted average of 14.1%. Similarly, the statistical analysis conducted on geographies consisting of 224,983,999 people shows a mild positive correlation between the proportion of Samoans and percentage of population receiving government assistance and/or food stamps in the United States with a correlation coefficient (R) of 0.363 and weighted average of 12.1%, a difference of 17.1%.
Receiving Food Stamps Correlation Summary
| Measurement | Creek | Samoan |
| Minimum | 5.6% | 0.70% |
| Maximum | 46.7% | 34.1% |
| Range | 41.1% | 33.4% |
| Mean | 17.7% | 14.6% |
| Median | 16.3% | 12.4% |
| Interquartile 25% (IQ1) | 12.8% | 10.4% |
| Interquartile 75% (IQ3) | 21.5% | 17.8% |
| Interquartile Range (IQR) | 8.7% | 7.4% |
| Standard Deviation (Sample) | 7.2% | 7.5% |
| Standard Deviation (Population) | 7.2% | 7.5% |
Similar Demographics by Receiving Food Stamps
Demographics Similar to Creek by Receiving Food Stamps
In terms of receiving food stamps, the demographic groups most similar to Creek are Central American (14.1%, a difference of 0.090%), Immigrants from Congo (14.1%, a difference of 0.11%), Immigrants from Ghana (14.1%, a difference of 0.12%), Arapaho (14.1%, a difference of 0.20%), and Japanese (14.1%, a difference of 0.30%).
| Demographics | Rating | Rank | Receiving Food Stamps |
| Ghanaians | 0.5 /100 | #252 | Tragic 14.0% |
| Spanish Americans | 0.4 /100 | #253 | Tragic 14.0% |
| Marshallese | 0.3 /100 | #254 | Tragic 14.1% |
| Sub-Saharan Africans | 0.3 /100 | #255 | Tragic 14.1% |
| Japanese | 0.3 /100 | #256 | Tragic 14.1% |
| Arapaho | 0.3 /100 | #257 | Tragic 14.1% |
| Immigrants | Ghana | 0.3 /100 | #258 | Tragic 14.1% |
| Creek | 0.3 /100 | #259 | Tragic 14.1% |
| Central Americans | 0.3 /100 | #260 | Tragic 14.1% |
| Immigrants | Congo | 0.3 /100 | #261 | Tragic 14.1% |
| Paiute | 0.2 /100 | #262 | Tragic 14.3% |
| Immigrants | Portugal | 0.2 /100 | #263 | Tragic 14.3% |
| Immigrants | Uzbekistan | 0.2 /100 | #264 | Tragic 14.3% |
| Blackfeet | 0.2 /100 | #265 | Tragic 14.3% |
| Cheyenne | 0.2 /100 | #266 | Tragic 14.3% |
Demographics Similar to Samoans by Receiving Food Stamps
In terms of receiving food stamps, the demographic groups most similar to Samoans are Venezuelan (12.0%, a difference of 0.18%), Immigrants from Peru (12.0%, a difference of 0.19%), Immigrants from Cameroon (12.0%, a difference of 0.24%), Sudanese (12.0%, a difference of 0.38%), and Immigrants from Fiji (12.1%, a difference of 0.53%).
| Demographics | Rating | Rank | Receiving Food Stamps |
| Immigrants | Iraq | 37.1 /100 | #185 | Fair 12.0% |
| Spanish | 36.9 /100 | #186 | Fair 12.0% |
| Albanians | 35.4 /100 | #187 | Fair 12.0% |
| Sudanese | 33.4 /100 | #188 | Fair 12.0% |
| Immigrants | Cameroon | 32.5 /100 | #189 | Fair 12.0% |
| Immigrants | Peru | 32.2 /100 | #190 | Fair 12.0% |
| Venezuelans | 32.1 /100 | #191 | Fair 12.0% |
| Samoans | 31.0 /100 | #192 | Fair 12.1% |
| Immigrants | Fiji | 27.8 /100 | #193 | Fair 12.1% |
| Immigrants | Sudan | 27.1 /100 | #194 | Fair 12.1% |
| Americans | 26.7 /100 | #195 | Fair 12.2% |
| Iraqis | 26.6 /100 | #196 | Fair 12.2% |
| Delaware | 26.1 /100 | #197 | Fair 12.2% |
| Immigrants | Costa Rica | 25.4 /100 | #198 | Fair 12.2% |
| Portuguese | 25.1 /100 | #199 | Fair 12.2% |