Creek vs Cheyenne Receiving Food Stamps
COMPARE
Creek
Cheyenne
Receiving Food Stamps
Receiving Food Stamps Comparison
Creek
Cheyenne
14.1%
RECEIVING FOOD STAMPS
0.3/ 100
METRIC RATING
259th/ 347
METRIC RANK
14.3%
RECEIVING FOOD STAMPS
0.2/ 100
METRIC RATING
266th/ 347
METRIC RANK
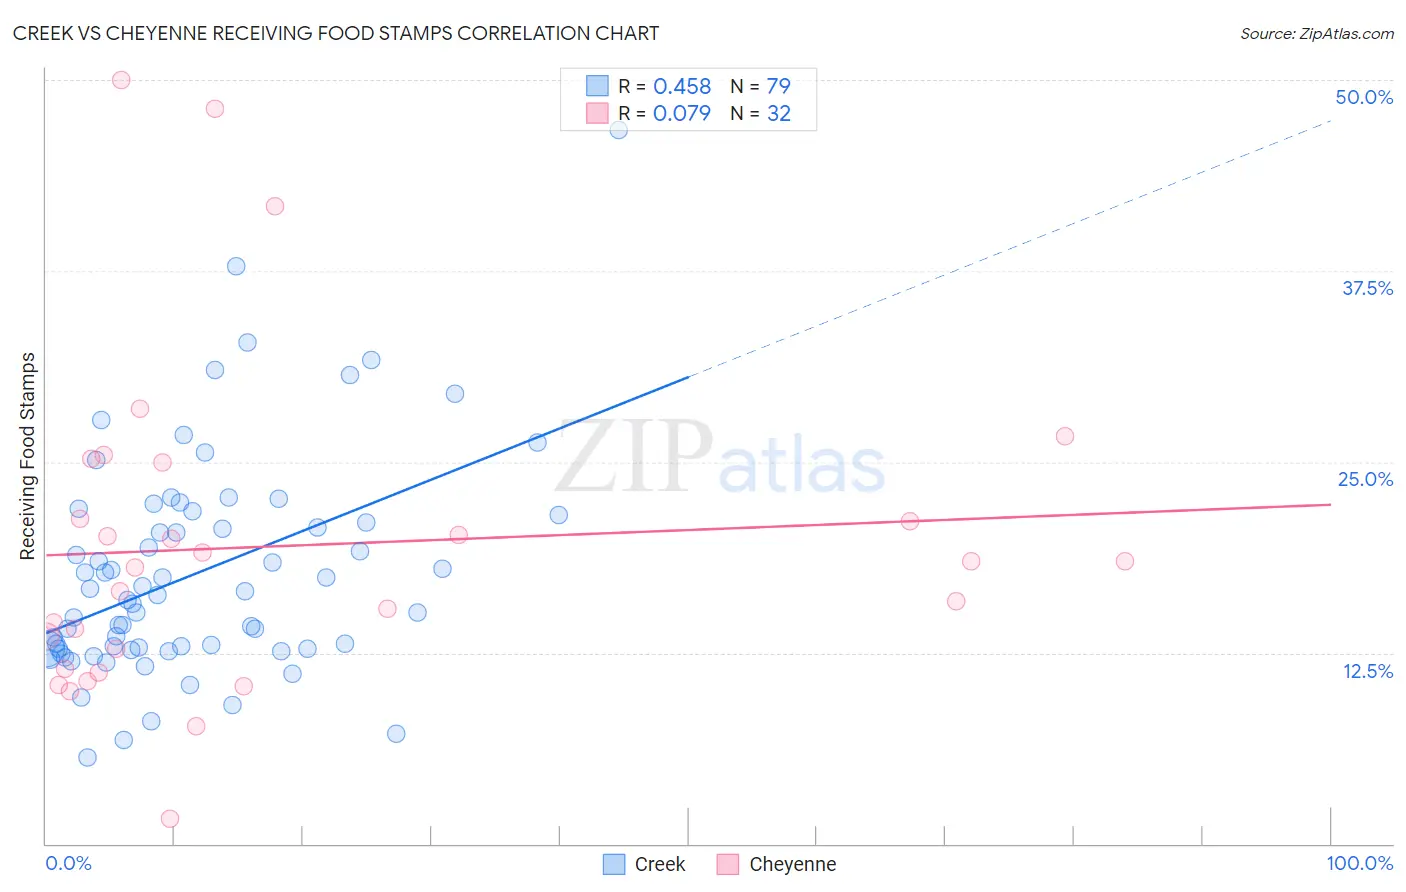
Creek vs Cheyenne Receiving Food Stamps Correlation Chart
The statistical analysis conducted on geographies consisting of 178,321,900 people shows a moderate positive correlation between the proportion of Creek and percentage of population receiving government assistance and/or food stamps in the United States with a correlation coefficient (R) of 0.458 and weighted average of 14.1%. Similarly, the statistical analysis conducted on geographies consisting of 80,695,470 people shows a slight positive correlation between the proportion of Cheyenne and percentage of population receiving government assistance and/or food stamps in the United States with a correlation coefficient (R) of 0.079 and weighted average of 14.3%, a difference of 1.1%.
Receiving Food Stamps Correlation Summary
| Measurement | Creek | Cheyenne |
| Minimum | 5.6% | 1.6% |
| Maximum | 46.7% | 50.0% |
| Range | 41.1% | 48.4% |
| Mean | 17.7% | 19.5% |
| Median | 16.3% | 18.3% |
| Interquartile 25% (IQ1) | 12.8% | 12.1% |
| Interquartile 75% (IQ3) | 21.5% | 23.2% |
| Interquartile Range (IQR) | 8.7% | 11.0% |
| Standard Deviation (Sample) | 7.2% | 10.8% |
| Standard Deviation (Population) | 7.2% | 10.6% |
Demographics Similar to Creek and Cheyenne by Receiving Food Stamps
In terms of receiving food stamps, the demographic groups most similar to Creek are Central American (14.1%, a difference of 0.090%), Immigrants from Congo (14.1%, a difference of 0.11%), Immigrants from Ghana (14.1%, a difference of 0.12%), Arapaho (14.1%, a difference of 0.20%), and Japanese (14.1%, a difference of 0.30%). Similarly, the demographic groups most similar to Cheyenne are Blackfeet (14.3%, a difference of 0.080%), Immigrants from Uzbekistan (14.3%, a difference of 0.14%), Dutch West Indian (14.3%, a difference of 0.22%), Paiute (14.3%, a difference of 0.23%), and Immigrants from Portugal (14.3%, a difference of 0.23%).
| Demographics | Rating | Rank | Receiving Food Stamps |
| Ghanaians | 0.5 /100 | #252 | Tragic 14.0% |
| Spanish Americans | 0.4 /100 | #253 | Tragic 14.0% |
| Marshallese | 0.3 /100 | #254 | Tragic 14.1% |
| Sub-Saharan Africans | 0.3 /100 | #255 | Tragic 14.1% |
| Japanese | 0.3 /100 | #256 | Tragic 14.1% |
| Arapaho | 0.3 /100 | #257 | Tragic 14.1% |
| Immigrants | Ghana | 0.3 /100 | #258 | Tragic 14.1% |
| Creek | 0.3 /100 | #259 | Tragic 14.1% |
| Central Americans | 0.3 /100 | #260 | Tragic 14.1% |
| Immigrants | Congo | 0.3 /100 | #261 | Tragic 14.1% |
| Paiute | 0.2 /100 | #262 | Tragic 14.3% |
| Immigrants | Portugal | 0.2 /100 | #263 | Tragic 14.3% |
| Immigrants | Uzbekistan | 0.2 /100 | #264 | Tragic 14.3% |
| Blackfeet | 0.2 /100 | #265 | Tragic 14.3% |
| Cheyenne | 0.2 /100 | #266 | Tragic 14.3% |
| Dutch West Indians | 0.2 /100 | #267 | Tragic 14.3% |
| Guatemalans | 0.1 /100 | #268 | Tragic 14.4% |
| Nepalese | 0.1 /100 | #269 | Tragic 14.6% |
| Mexicans | 0.1 /100 | #270 | Tragic 14.6% |
| Immigrants | Guatemala | 0.1 /100 | #271 | Tragic 14.6% |
| Chippewa | 0.1 /100 | #272 | Tragic 14.7% |