Creek vs Belgian Receiving Food Stamps
COMPARE
Creek
Belgian
Receiving Food Stamps
Receiving Food Stamps Comparison
Creek
Belgians
14.1%
RECEIVING FOOD STAMPS
0.3/ 100
METRIC RATING
259th/ 347
METRIC RANK
10.2%
RECEIVING FOOD STAMPS
97.7/ 100
METRIC RATING
93rd/ 347
METRIC RANK
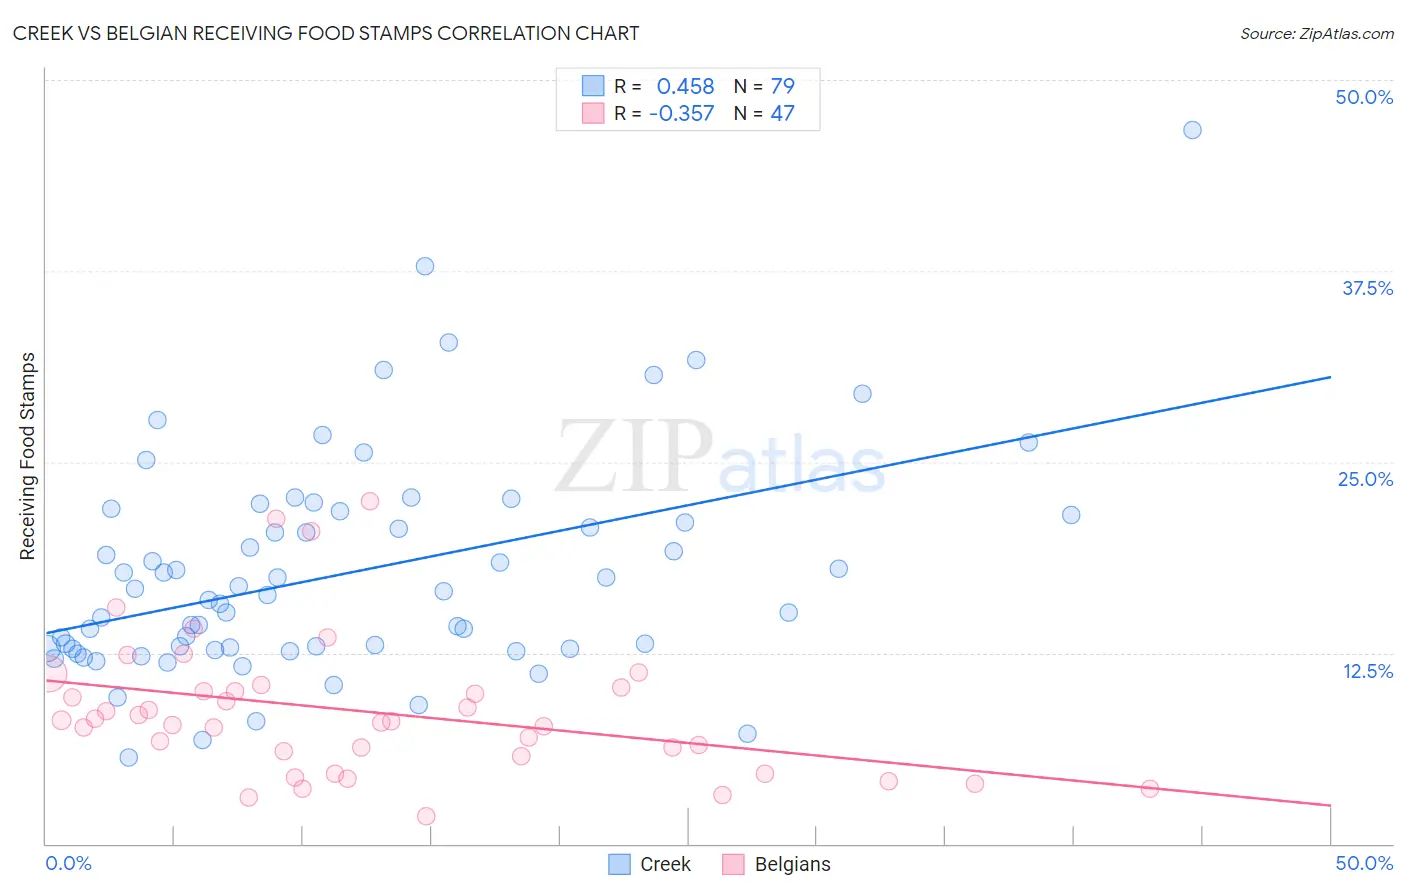
Creek vs Belgian Receiving Food Stamps Correlation Chart
The statistical analysis conducted on geographies consisting of 178,321,900 people shows a moderate positive correlation between the proportion of Creek and percentage of population receiving government assistance and/or food stamps in the United States with a correlation coefficient (R) of 0.458 and weighted average of 14.1%. Similarly, the statistical analysis conducted on geographies consisting of 355,046,721 people shows a mild negative correlation between the proportion of Belgians and percentage of population receiving government assistance and/or food stamps in the United States with a correlation coefficient (R) of -0.357 and weighted average of 10.2%, a difference of 38.6%.
Receiving Food Stamps Correlation Summary
| Measurement | Creek | Belgian |
| Minimum | 5.6% | 1.8% |
| Maximum | 46.7% | 22.4% |
| Range | 41.1% | 20.6% |
| Mean | 17.7% | 8.7% |
| Median | 16.3% | 8.1% |
| Interquartile 25% (IQ1) | 12.8% | 5.8% |
| Interquartile 75% (IQ3) | 21.5% | 10.2% |
| Interquartile Range (IQR) | 8.7% | 4.4% |
| Standard Deviation (Sample) | 7.2% | 4.6% |
| Standard Deviation (Population) | 7.2% | 4.5% |
Similar Demographics by Receiving Food Stamps
Demographics Similar to Creek by Receiving Food Stamps
In terms of receiving food stamps, the demographic groups most similar to Creek are Central American (14.1%, a difference of 0.090%), Immigrants from Congo (14.1%, a difference of 0.11%), Immigrants from Ghana (14.1%, a difference of 0.12%), Arapaho (14.1%, a difference of 0.20%), and Japanese (14.1%, a difference of 0.30%).
| Demographics | Rating | Rank | Receiving Food Stamps |
| Ghanaians | 0.5 /100 | #252 | Tragic 14.0% |
| Spanish Americans | 0.4 /100 | #253 | Tragic 14.0% |
| Marshallese | 0.3 /100 | #254 | Tragic 14.1% |
| Sub-Saharan Africans | 0.3 /100 | #255 | Tragic 14.1% |
| Japanese | 0.3 /100 | #256 | Tragic 14.1% |
| Arapaho | 0.3 /100 | #257 | Tragic 14.1% |
| Immigrants | Ghana | 0.3 /100 | #258 | Tragic 14.1% |
| Creek | 0.3 /100 | #259 | Tragic 14.1% |
| Central Americans | 0.3 /100 | #260 | Tragic 14.1% |
| Immigrants | Congo | 0.3 /100 | #261 | Tragic 14.1% |
| Paiute | 0.2 /100 | #262 | Tragic 14.3% |
| Immigrants | Portugal | 0.2 /100 | #263 | Tragic 14.3% |
| Immigrants | Uzbekistan | 0.2 /100 | #264 | Tragic 14.3% |
| Blackfeet | 0.2 /100 | #265 | Tragic 14.3% |
| Cheyenne | 0.2 /100 | #266 | Tragic 14.3% |
Demographics Similar to Belgians by Receiving Food Stamps
In terms of receiving food stamps, the demographic groups most similar to Belgians are Irish (10.2%, a difference of 0.38%), Jordanian (10.2%, a difference of 0.39%), Finnish (10.2%, a difference of 0.42%), Immigrants from Greece (10.3%, a difference of 0.53%), and Basque (10.3%, a difference of 0.55%).
| Demographics | Rating | Rank | Receiving Food Stamps |
| Immigrants | Norway | 98.4 /100 | #86 | Exceptional 10.0% |
| Egyptians | 98.4 /100 | #87 | Exceptional 10.0% |
| Immigrants | Kuwait | 98.4 /100 | #88 | Exceptional 10.0% |
| Immigrants | France | 98.3 /100 | #89 | Exceptional 10.1% |
| Finns | 97.9 /100 | #90 | Exceptional 10.2% |
| Jordanians | 97.9 /100 | #91 | Exceptional 10.2% |
| Irish | 97.9 /100 | #92 | Exceptional 10.2% |
| Belgians | 97.7 /100 | #93 | Exceptional 10.2% |
| Immigrants | Greece | 97.4 /100 | #94 | Exceptional 10.3% |
| Basques | 97.4 /100 | #95 | Exceptional 10.3% |
| Welsh | 97.3 /100 | #96 | Exceptional 10.3% |
| Czechoslovakians | 97.2 /100 | #97 | Exceptional 10.3% |
| Immigrants | Egypt | 97.1 /100 | #98 | Exceptional 10.3% |
| Serbians | 97.0 /100 | #99 | Exceptional 10.3% |
| Immigrants | Western Europe | 96.9 /100 | #100 | Exceptional 10.3% |