Immigrants from Cambodia vs Houma Female Poverty Among 18-24 Year Olds
COMPARE
Immigrants from Cambodia
Houma
Female Poverty Among 18-24 Year Olds
Female Poverty Among 18-24 Year Olds Comparison
Immigrants from Cambodia
Houma
18.8%
FEMALE POVERTY AMONG 18-24 YEAR OLDS
99.5/ 100
METRIC RATING
76th/ 347
METRIC RANK
26.2%
FEMALE POVERTY AMONG 18-24 YEAR OLDS
0.0/ 100
METRIC RATING
332nd/ 347
METRIC RANK
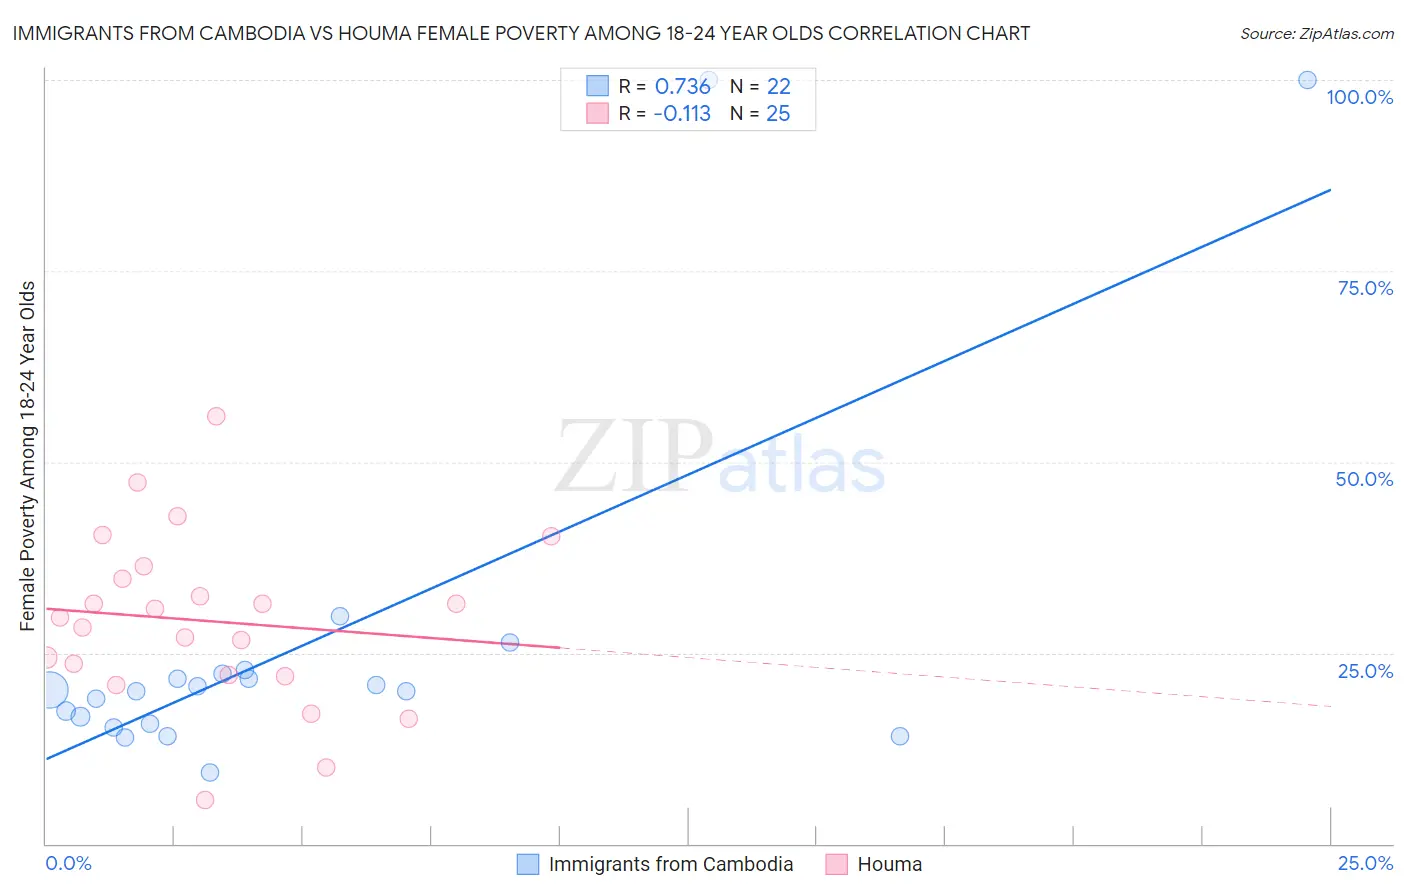
Immigrants from Cambodia vs Houma Female Poverty Among 18-24 Year Olds Correlation Chart
The statistical analysis conducted on geographies consisting of 203,303,935 people shows a strong positive correlation between the proportion of Immigrants from Cambodia and poverty level among females between the ages 18 and 24 in the United States with a correlation coefficient (R) of 0.736 and weighted average of 18.8%. Similarly, the statistical analysis conducted on geographies consisting of 36,618,001 people shows a poor negative correlation between the proportion of Houma and poverty level among females between the ages 18 and 24 in the United States with a correlation coefficient (R) of -0.113 and weighted average of 26.2%, a difference of 39.4%.
Female Poverty Among 18-24 Year Olds Correlation Summary
| Measurement | Immigrants from Cambodia | Houma |
| Minimum | 9.3% | 5.7% |
| Maximum | 100.0% | 56.0% |
| Range | 90.7% | 50.3% |
| Mean | 26.4% | 29.2% |
| Median | 20.1% | 29.6% |
| Interquartile 25% (IQ1) | 15.8% | 22.1% |
| Interquartile 75% (IQ3) | 22.2% | 35.5% |
| Interquartile Range (IQR) | 6.4% | 13.5% |
| Standard Deviation (Sample) | 24.2% | 11.3% |
| Standard Deviation (Population) | 23.7% | 11.1% |
Similar Demographics by Female Poverty Among 18-24 Year Olds
Demographics Similar to Immigrants from Cambodia by Female Poverty Among 18-24 Year Olds
In terms of female poverty among 18-24 year olds, the demographic groups most similar to Immigrants from Cambodia are Polish (18.8%, a difference of 0.080%), Costa Rican (18.8%, a difference of 0.10%), Immigrants from Europe (18.8%, a difference of 0.11%), Uruguayan (18.8%, a difference of 0.11%), and Palestinian (18.8%, a difference of 0.19%).
| Demographics | Rating | Rank | Female Poverty Among 18-24 Year Olds |
| Immigrants | Bulgaria | 99.7 /100 | #69 | Exceptional 18.6% |
| Immigrants | Costa Rica | 99.7 /100 | #70 | Exceptional 18.7% |
| Immigrants | Haiti | 99.7 /100 | #71 | Exceptional 18.7% |
| Armenians | 99.7 /100 | #72 | Exceptional 18.7% |
| Lithuanians | 99.7 /100 | #73 | Exceptional 18.7% |
| Hawaiians | 99.6 /100 | #74 | Exceptional 18.7% |
| Poles | 99.6 /100 | #75 | Exceptional 18.8% |
| Immigrants | Cambodia | 99.5 /100 | #76 | Exceptional 18.8% |
| Costa Ricans | 99.5 /100 | #77 | Exceptional 18.8% |
| Immigrants | Europe | 99.5 /100 | #78 | Exceptional 18.8% |
| Uruguayans | 99.5 /100 | #79 | Exceptional 18.8% |
| Palestinians | 99.5 /100 | #80 | Exceptional 18.8% |
| Japanese | 99.5 /100 | #81 | Exceptional 18.8% |
| Immigrants | Uruguay | 99.4 /100 | #82 | Exceptional 18.8% |
| Immigrants | Indonesia | 99.4 /100 | #83 | Exceptional 18.9% |
Demographics Similar to Houma by Female Poverty Among 18-24 Year Olds
In terms of female poverty among 18-24 year olds, the demographic groups most similar to Houma are Apache (26.3%, a difference of 0.53%), Chippewa (25.9%, a difference of 1.0%), Immigrants from Somalia (25.7%, a difference of 1.7%), Cajun (25.7%, a difference of 1.9%), and Pueblo (26.9%, a difference of 2.8%).
| Demographics | Rating | Rank | Female Poverty Among 18-24 Year Olds |
| Immigrants | Saudi Arabia | 0.0 /100 | #325 | Tragic 25.3% |
| Yakama | 0.0 /100 | #326 | Tragic 25.3% |
| Ute | 0.0 /100 | #327 | Tragic 25.4% |
| Natives/Alaskans | 0.0 /100 | #328 | Tragic 25.4% |
| Cajuns | 0.0 /100 | #329 | Tragic 25.7% |
| Immigrants | Somalia | 0.0 /100 | #330 | Tragic 25.7% |
| Chippewa | 0.0 /100 | #331 | Tragic 25.9% |
| Houma | 0.0 /100 | #332 | Tragic 26.2% |
| Apache | 0.0 /100 | #333 | Tragic 26.3% |
| Pueblo | 0.0 /100 | #334 | Tragic 26.9% |
| Yup'ik | 0.0 /100 | #335 | Tragic 27.0% |
| Immigrants | Yemen | 0.0 /100 | #336 | Tragic 27.5% |
| Cheyenne | 0.0 /100 | #337 | Tragic 28.1% |
| Hopi | 0.0 /100 | #338 | Tragic 28.2% |
| Pima | 0.0 /100 | #339 | Tragic 28.4% |